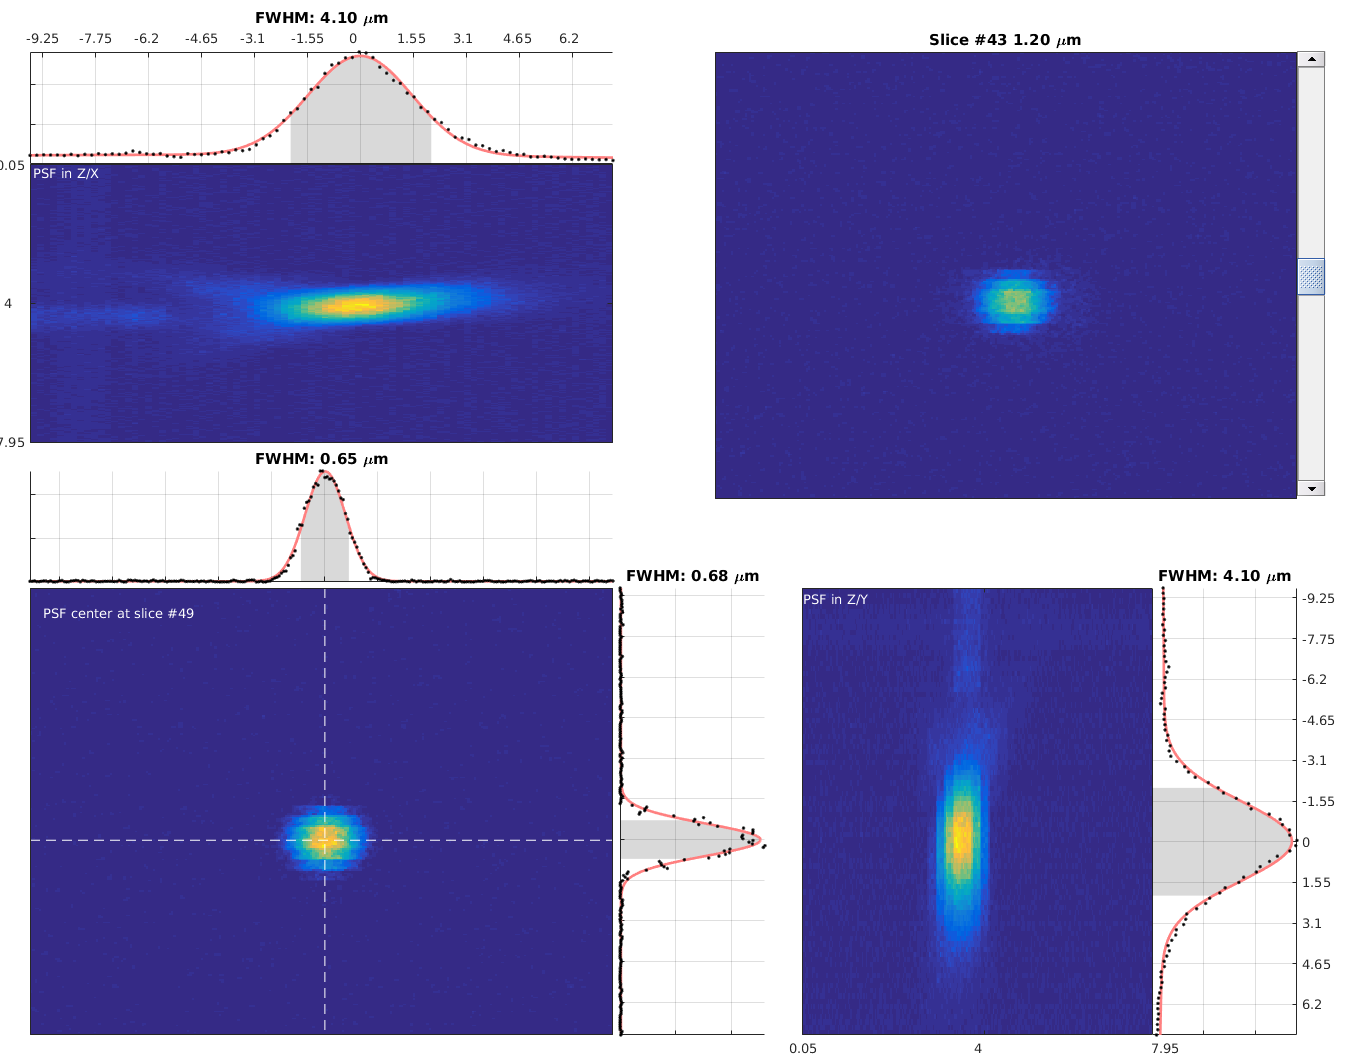
This repository contains tools for measuring microscope performance with ScanImage. In particular, there are functions for recording and measuring Point Spread Functions (PSFs), and for measuring field of view size using an EM grid.
mpsf.record.PSFto easily acquire PSF stacks with ScanImage.measurePSFto estimate PSF size. For a demo, runmeasurePSF('demo').Grid2MicsPerPixelmeasures the number of microns per pixel along x and y by analyzing an image of an EM grid.mpsf_tools.meanFrameplots the mean frame intensity as a function of time whilst you are scanning.
Add the measurePSF code directory to your MATLAB path.
You do not need to "Add With Subfolders".
To get a good image of a sub-micron bead:
- Use image sizes of about 256x256 to 512x512 pixels.
- Once a bead is found, zoom to about 20x or 25x.
- Take a z-plane every 0.25 microns and average about 25 to 40 images per per plane. It's not worth doing more because we'll be fitting a curve to z-intensity profile.
To measure the PSF you can either use the included mpsf.record.PSF function or manually set up ScanImage (see documentation folder if you need to do that).
- Find a bead, zoom in.
- Select only one channel to save in the CHANNELS window.
- Set the averaging to the quantity you wish to use in the Image Controls window.
- Move the focus down to the lowest point you wish to image and press press "Zero Z" in MOTOR CONTROLS
- Now focus back up to where you want to start the stack and press "Read Pos" in MOTOR CONTROLS. This is the number of microns you will acquire (ignore the negative sign if present).
- Run
mpsf.record.PSFwith number of microns obtained above as the first input argument. This will obtain the stack with a 0.25 micron resolution using the averaging you have set. e.g.record.PSF(12)for a 12 micron stack. The save location is reported to screen. You can define a different z resolution using the second input argument.
To view the PSF run measurePSF and load the saved stack using the GUI. For more info type help measurePSF.
If loading ScanImage TIFFs the voxel size is extracted automatically from the header information in the file.
Otherwise, this information can be provided using the second and third input arguments (see help measurePSF).
See documentation folder for how to make an EM grid slide.
To image the slide:
- Copper will autofluoresce when illuminated by a 2-photon laser.
- Use any 2p wavelength and very low power e.g. 3 mW.
- The grid should be oriented so that it's aligned relatively closely with the scan axes (i.e. the edges of the image).
This will make it easier to see distortions by eye and also to run
Grid2MicsPerPixel. - Hit "Focus" in ScanImage. Acquire data with just one channel. Get a good clear grid image and average a few frames if needed.
- Press "Abort" to stop scanning once a good image is obtained.
- Run
Grid2MicsPerPixelto measure the FOV. The function will automatically pull data from ScanImage. Look at the diagnostic figures to ensure function has found most of the grid lines (it uses the median grid line distance so you don't need all the lines). If very few grid lines are detected, the results will be meaningless. - You can use the buttons in the GUI to obtain new images.
- Once you are happy with the results you can use the "Apply FOV" button to calibrate ScanImage.
Run mpsf_tools.meanFrame to bring up a figure window that plots mean frame intensity during scanning.
This function is used for things like tweaking a pre-chirper.
See help mpsf_tools.meanFrame for advanced usage.
To record data:
mpsf.record.uniform_slideThe results are saved to a folder on the desktop. You can view the results as follows:
% cd to directory containing data
mpsf.plot.uniform_slide('uniform_slice_zoom_1_920nm_5mW__2022-08-02_10-09-33_00001.tif')You can generate a PDF report of all conducted analyses using
>> generateMPSFreportThe function has been well well-tested under R2016b and later. It should also work on R2016a. It's known to fail on 2015b and earlier. Requires the Curve-Fitting Toolbox, the Image Processing Toolbox, and the Stats Toolbox. The MATLAB Report Generator is needed if you want to make PDF reports. It is known to work with ScanImage 2020 to 2022 and likely earlier versions are also OK.
Please see the list of known obvious issues before using the software.
This code has been written in collaboration with Fred Marbach (SWC), and Bruno Pichler and Mark Walling of INSS.
- 2023/07/31 -- Integrate functionality of making PDF reports, uniform slide analyses, and plots of lens paper.
- 2022/08/02 -- Add function for imaging electrical noise and document protocol.
- 2022/08/01 -- Add functions for recording lens paper and uniform slides.
- 2020/02/19 -- Add tiff stack name to title of top right plot. v 5.0
- 2020/02/18 -- tidy measurePSF pdf and add dummy values to demo mode. v 4.75
- 2020/02/18 -- bug fixes, check coarse z acquisition works, add PDF saving to grid tool. v 4.5
- 2020/02/17 -- bugfixes v3.25
- 2020/02/12 -- bugfixes v2.75
- 2020/01/30 -- Add "mpsf_tools.meanFrame" for displaying a rolling frame average.
- 2020/01/14 -- Add button that allows the current image to be saved to the desktop.
- 2020/01/14 -- Add edit boxes and checkboxes to allow the user to modify on the fly what would otherwise have been input arguments.
- 2020/01/14 -- Get voxel size from ScanImage TIFF header.
- 2020/01/14 -- If no input args to measurePSF, bring up the load GUI.
- 2020/01/13 -- Convert Grid2MicsPerPixel to a class and add buttons to interact with SI.
- 2020/01/08 -- Grid2MicsPerPixel optionally can extract the grid image directly from ScanImage.
- 2018/11/09 -- Add
record.PSF. - 2017/11/28 -- Simple GUI for interactive cropping of a desired bead.
- 2017/11/28 -- Improve output data and don't display FWHM for directions in which the user defined no microns per pixel.
- 2017/11/27 -- Convert
measurePSFto a class so adding new features is easier.
