SOCR 2D and 3D Clustering and Dimensionality Reduction RShiny App
The SOCR 2D and 3D Clustering and Dimensionality Reduction RShiny App provides an interactive web-based user interface to display multi-variate and high-dimensional data in 2D and 3D, see the SOCR RConnect Server App Demo.
The examples, demonstrations and simulations are designed, built, implemented and validated in the R environment.
The source R code for the package is in the code folder.
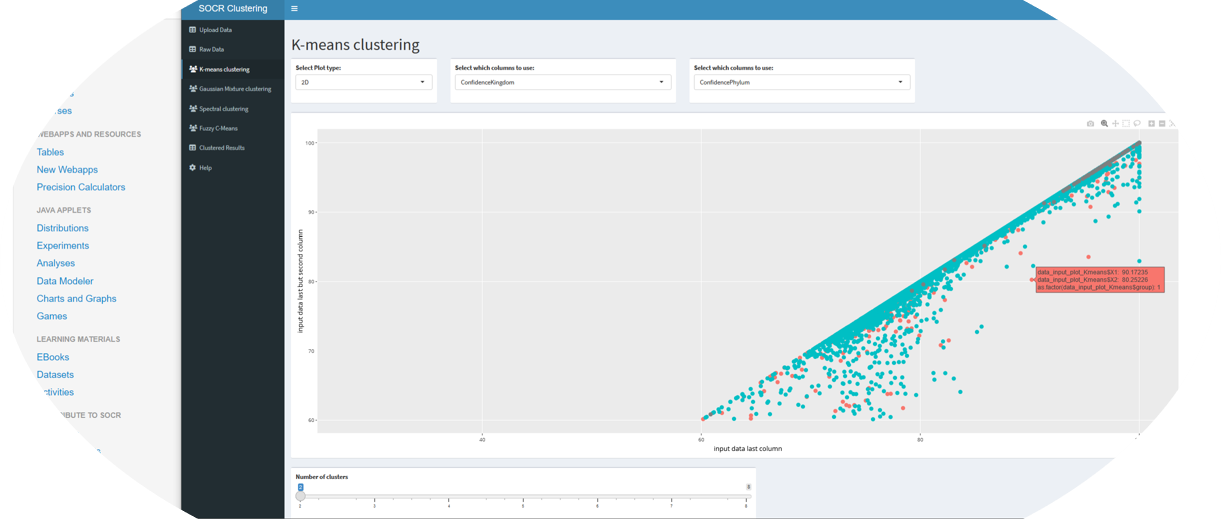
This versatile application encompasses a variety of clustering algorithms such as K-means, Gaussian Mixture, Spectral Clustering, Fuzzy C-Means, Decision Tree, Hierarchical Clustering, and Poisson Clustering. Key features include:
- Plot generation for visual interpretation.
- Downloading results in CSV format.
- Exporting plots in HTML format.
Important Note: Each clustering algorithm is compatible with specific data formats. In case of a clustering failure, refer to the error message for guidance on dataset requirements.
The ANOVA Pairwise Comparison feature extends beyond just conducting ANOVA tests on datasets. It's capable of performing Post-Hoc Tests through pairwise p-value comparisons and generating informative plots. This functionality draws its inspiration from the moreThanANOVA GitHub repository. There are many functionalities in this section including one-way ANOVA test and Kruskal Wallis H test.
Important Notes: This feature is currently designed to support datasets with two columns: the first for group/category designation and the second for corresponding values. We encourage future developers to enhance this tool to accommodate various dataset formats.
In terms of functionality, the ANOVA Pairwise Comparison mirrors the computational logic of moreThanANOVA but with significant enhancements. A notable addition is the ability to produce an interactive plot showcasing the violin plots and Post-Hoc Test results. Users can expect to see two types of plots:
- A standard plot displaying the Post-Hoc test outcomes.
- An interactive plot integrating both a violin plot and Post-Hoc test results, with the pairwise p-value comparison details accessible via the "Interactive Plot" button.
This function can run only the 1-way ANOVA testing for the provided dataset. It cannot generate the plot. However, this function can allow two types of dataset:
- A two-column format, where the first column contains the data values and the second column contains the corresponding group labels ('data', 'group')
- A multi-column format, where each column represents a different group, and the rows contain the data values for each group ('group1', 'group2', 'group3', ...)
In addition to the download capabilities for various clustering algorithms, we have introduced a "Combined Clustered Results" feature. This innovative function allows users to download an HTML file encompassing all the interactive plots from the selected clustering algorithms. The current implementation of this feature utilizes HTML, JavaScript, and CSS for robust and interactive output. We encourage future developers to explore the integration of R Markdown (RMD) templates as an alternative approach for enhancing this functionality.
This section introduces few parts that can be improved inthe future
- Enhanced Sorting in Pairwise Comparison: The present version displays all pairwise comparisons of P-values for groups in the dataset. A beneficial enhancement would be to sort these outputs based on the P-values. We propose to include an option allowing users to select between the most similar or most different pairs. Based on this selection, the system could then provide a sorted list of pairwise results. Furthermore, it's feasible to add a feature where users can choose to view either the top 5 pairs with the highest P-values or the top 5 with the lowest, tailoring the output to their specific needs.
- Optimizing Interactive Plot Logic: The interactive plot currently relies on data extracted from the output objects of ggbetweenstats and pairwise_comparisons. We encourage future developers to review the existing code to grasp the underlying logic of this data extraction process. There's potential to streamline and optimize this feature for more efficient and effective data handling.
- Streamlining Plot Generation: In the current setup, users need to initiate the stable plot by clicking the 'Start Plot' button, followed by activating the interactive plot separately. A more user-friendly approach would be to consolidate this into a single action, perhaps with one button that simultaneously generates both the stable and interactive plots. This modification would simplify the user experience and enhance overall workflow efficiency.
- Supporting different dataset format: In the current setup, this function only support two columns dataset. We encourage future developers to make this to support different dataset format. Please refer the code in 1-way ANOVA Computation because this section can support mutiple columns dataset.
- This function can be removed if the Pairwise ANOVA Comparison can support different format of dataset since they are doing the same work.
- This function can work well by outputing an HTML file. We encourage to make the output HTML file more beautiful by adding Javascript or CSS code to it.
- Using Rmd template is another way to generate the plot. The future developers can explore this new way.
- Decision Tree Clustering method doesn't have a proper HTML downloading function for now. The future developers should review the code and add a interactive plot downloading function for this.
SOCR Team including Shihang Li, Yongxiang Zhao, Yanghe Liu, Simeone Marino, Ivo D. Dinov, and others.
This work is supported in part by NIH grants UL1TR002240, R01CA233487, R01MH121079, R01MH126137, T32GM141746, and NSF grants 1916425, 1734853, 1636840, 1416953, 0716055 and 1023115. Students, trainees, scholars, and researchers from SOCR, MICHR, and the broad R-statistical computing community have contributed ideas, code, and support.
- RShiny 2D/3D Clustering App.
- Dinov, ID. (2008) Expectation Maximization and Mixture Modeling Tutorial. UCLA Statistics Online Computational Resource, UC eScholarship, University of California, http://escholarship.org/uc/item/1rb70972.