This project started from the vscode webview react project. It works this way, with the extension itself being in the vscode-trace-extension directory and the react application being in the vscode-trace-webapps directory.
👋 Want to help? Read our contributor guide and follow the instructions to contribute code.
The code was migrated from the PR in theia-trace-extension.
It depends on the trace viewer plugins from the theia trace extension package and the tsp typescript client, as well as the timeline chart. They are all available from the NPM package registry.
- timeline-chart
- traceviewer-base
- traceviewer-react-components
- tsp-typescript-client
To build the vscode extension, run the yarn command:
yarnThen from vscode, press f5 to run the extension. The trace server needs to be started separately as described here.
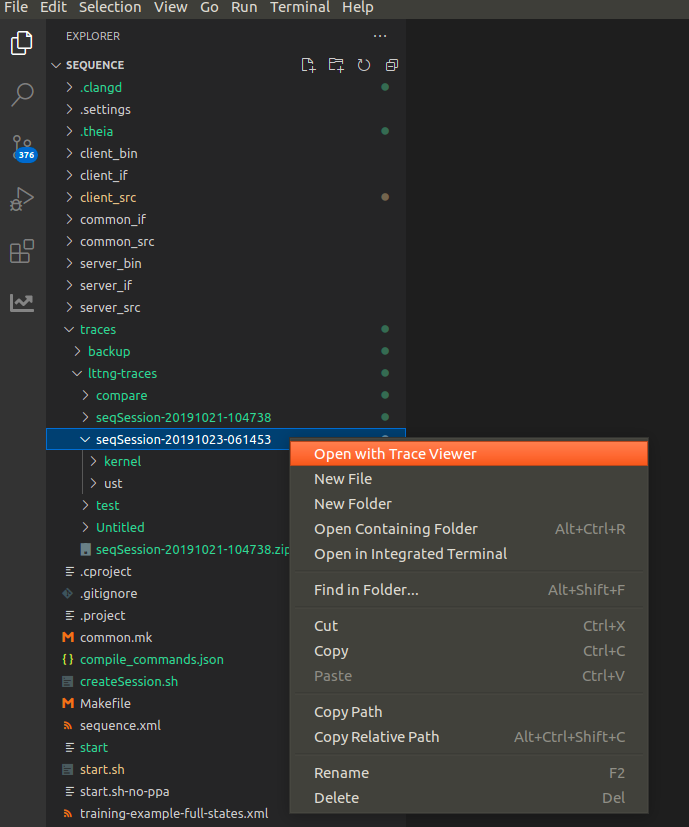
To open a trace use the VSCode file explorer to navigate to the trace directory. Then right mouse click on the trace and select menu option Open with Trace Viewer. See here to get some sample traces.
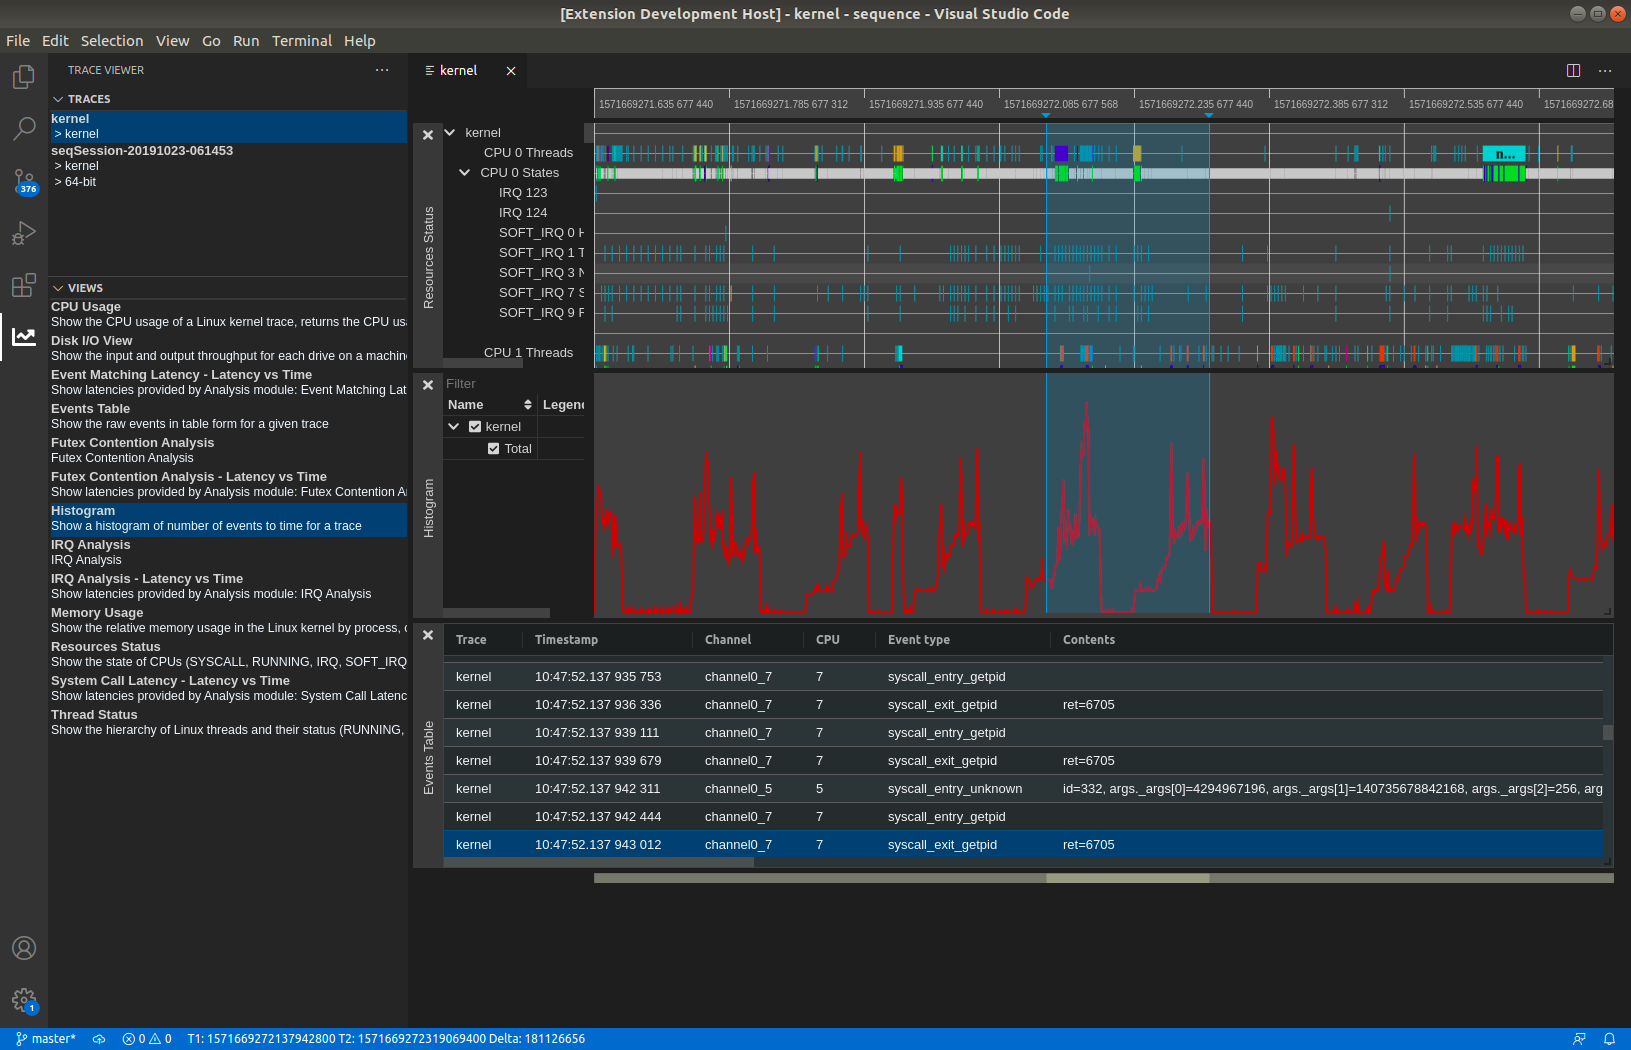
Open the Trace Viewer view (View -> Open view...).
2 tabs will be visible: Traces and Views. The Traces tab will show all available traces on the trace server.
The Views tab shows all the available views for the selected trace. Click on a view to open the view under the timeline.
To package it as VsCode extension, run the command yarn vsce:package. If you get errors about case-sensitive files, just delete the node_modules folder and run yarn again.
The packaging will produce a vscode-trace-extension-x.x.x.vsix file in the subdirectory vscode-trace-extension of the repo.
The packaged VSIX file can be installed in an existing VsCode, VsCodium or Theia application by using Install from a vsix.
The trace server needs to be started separately as described here.
The packaged VSIX file can be run in the example app of the theia-trace-extension. For this the file can be can be symlinked in the plugins of the example app of theia-trace-extension repo.
cd <theia-trace-extension root>/examples/plugins
ln -s <vscode-trace-extension root>/vscode-trace-extension-x.x.x.vsix ./When having to modify the code of the extension (in the vscode-trace-extension folder), one can simply run the yarn command. It is also possible to watch for changes to have no manual steps to do before re-running the extension: yarn watch or ctrl-shift-b and select the task npm: watch - vscode-trace-extension.
For changes in the webview part (in the vscode-trace-webviews folder), you can run the yarn command, simply re-opening a trace should show the changes. It is also possible to watch for changes with yarn watch or ctrl-shift-b and selecting the task npm: watch - vscode-trace-webviews.
For more information about VsCode WebView API see here.
To communicate between VsCode extension and webviews use the VsCode message API. When using vscode.postMessage(data) data structure data will be serialized to JSON before being propagated. Be aware that it cannot include data structures like BigInt. Proper handling of such data structures need to be implemented when sending and receiving messages.
Inside a webview or inside the extension signals can be used where data structures can be passed on.
The following sequence diagram shows how the experiment-selected signal (with payload Experiment) is propagated inside the application. The webview Opened Traces WebView App is sending the signal to theVsCode extension which is forwarding the signal to the Available Views WebView App.
sequenceDiagram
    actor User
    participant reactOpenTraces as ReactOpenTracesWidget
    participant explorerOpenTraces as TraceExplorerOpenedTraces
    participant exOpenTraceProvider as TraceExplorerOpenedTracesViewProvider
    participant exViewsAvailProvider as TraceExplorerAvailableViewsProvider
    participant explorerAvailView as TraceExplorerViewsWidget
    participant reactAvailViewsexplorerOpenTraces as ReactAvailableViewsWidget
    participant server as Trace Server
    User->>reactOpenTraces: click on trace
    Note over reactOpenTraces,explorerOpenTraces: Opened Traces WebView App
    Note over exOpenTraceProvider,exViewsAvailProvider: VsCode extension
    Note over explorerAvailView,reactAvailViewsexplorerOpenTraces: Available Views WebView App
    reactOpenTraces->>explorerOpenTraces: sendSignal(exp-sel)
    explorerOpenTraces->>exOpenTraceProvider: vcode.postMessage(exp-sel)
    exOpenTraceProvider->>exViewsAvailProvider: sendSignal(exp-sel)
    exViewsAvailProvider->>explorerAvailView: vcode.postMessage(exp-sel)
    explorerAvailView->>reactAvailViewsexplorerOpenTraces: sendSignal(exp-sel)
    reactAvailViewsexplorerOpenTraces->>server: fetchOutputs(exp)
    server->>reactAvailViewsexplorerOpenTraces: success(200)
    reactAvailViewsexplorerOpenTraces->>reactAvailViewsexplorerOpenTraces: visualize availableViews
It is straightforward to debug the code of the vscode extension itself (the code in vscode-trace-extension) by just putting breakpoints in vscode and running the extension with f5.
The react-app is another matter. The panel is a webview that is running in its own context, so current vscode does not have access to it. (Patches welcome!)
Each panel is its own small web application, so to debug, while in the context of the webview, press ctrl-shift-p and enter the command Developer: Open Webview Developer Tools. This will open the developer tools. The code is in the Sources tab of the developer tools window that opens.
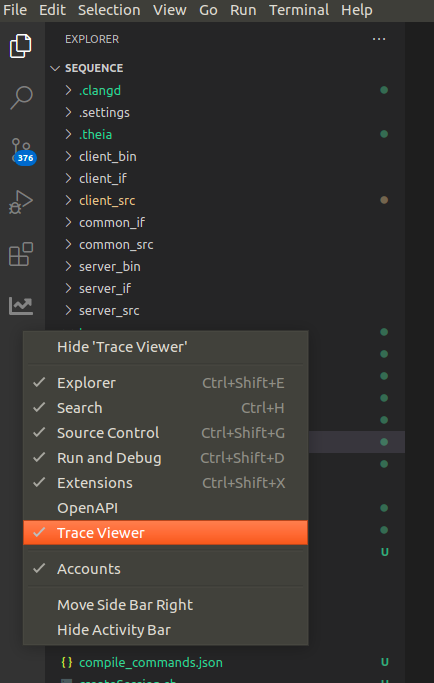
*The Trace Viewer panel is not there, or disappears when switching panel.
Right-click on the vscode activity bar and make sure Trace Viewer is checked.
In order to open traces, you need a trace server running on the same machine as the trace extension. You can download the Eclipse Trace Compass server or let yarn download and run it:
yarn download:server
yarn start:server
You can also build the trace-server yourself using Trace Compass and the Incubator. Take a look at the instructions here.
To get sample traces to try run the following command. The traces will be stored under the subdirectory TraceCompassTutorialTraces of the repo.
yarn download:sample-traces