![]()
![]()
![]()
![]()

Sequential or temporal observations emerge in many key real-world problems, ranging from biological data, financial markets, weather forecasting, to audio and video processing. The field of time series encapsulates many different problems, ranging from analysis and inference to classification and forecast.
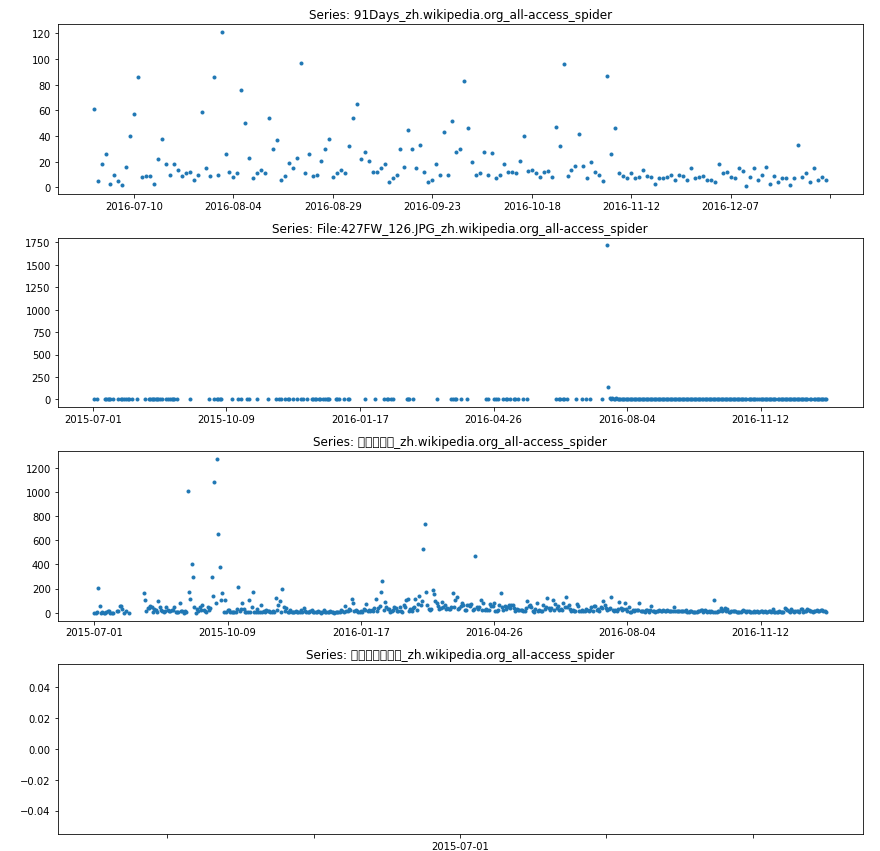
This project focuses on the problem of forecasting the future values of multiple time series, as it has always been one of the most challenging problems in the field. Here, we specifically focused on the problem of forecasting future web traffic for approximately 145,000 Wikipedia articles.
The training dataset consists of approximately 145k time series. Each of these time series represent a number of daily views of a different Wikipedia article, starting from July, 1st, 2015 up until December 31st, 2016. For each time series, you are provided the name of the article as well as the type of traffic that this time series represent (all, mobile, desktop, spider).
Files used for the first stage will end in '_1'. Files used for the second stage will end in '_2'. Both will have identical formats. The complete training data for the second stage will be made available prior to the second stage.
- train_*.csv - contains traffic data. This a csv file where each row corresponds to a particular article and each column correspond to a particular date. Some entries are missing data. The page names contain the Wikipedia project (e.g. en.wikipedia.org), type of access (e.g. desktop) and type of agent (e.g. spider). In other words, each article name has the following format: 'name_project_access_agent' (e.g. 'AKB48_zh.wikipedia.org_all-access_spider').
- key_*.csv - gives the mapping between the page names and the shortened Id column used for prediction
Libraries: NumPy pandas sklearn Matplotlib

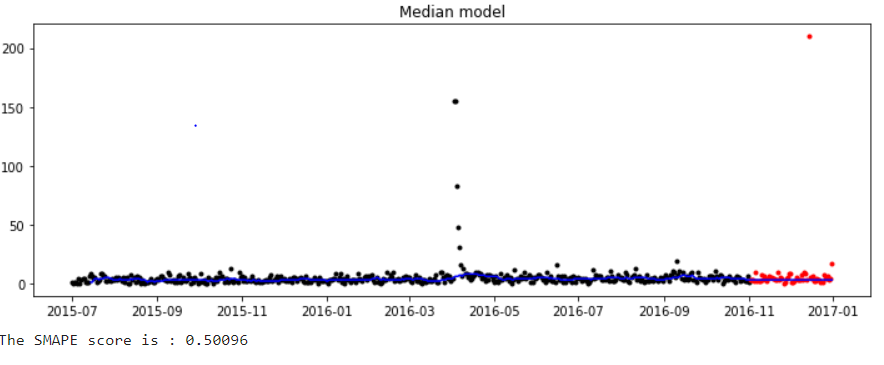
The SMAPE is one of the alternatives to overcome the limitations with MAPE forecast error measurement. In contrast to the mean absolute percentage error, SMAPE has both a lower bound and an upper bound, therefore, it is known as symmetric. The ‘S’ in SMAPE stands for symmetric, ‘M’ stands for mean which takes in the average value over a series, ‘A’ stands for absolute that uses absolute values to keep the positive and negative errors from canceling one another out, ‘P’ is the percentage which makes this accuracy metric a relative metric, and the ‘E’ stands for error since this metric helps to determine the amount of error our forecast has.


Facebook prophet library is created by facebook and aims to create a human-friendly time series forecasting libary.

Checkout the Notebook for complete analysis.
Time Series Forecasting
If you have any feedback, please reach out at pradnyapatil671@gmail.com
I am an AI Enthusiast and Data science & ML practitioner
![]()
![]()
![]()
![]()