![]()
![]()
![]()
![]()

Customer churn is defined as when customers or subscribers discontinue doing business with a firm or service.
Customers in the telecom industry can choose from a variety of service providers and actively switch from one to the next. The telecommunications business has an annual churn rate of 15-25 percent in this highly competitive market.
Individualized customer retention is tough because most firms have a large number of customers and can't afford to devote much time to each of them. The costs would be too great, outweighing the additional revenue. However, if a corporation could forecast which customers are likely to leave ahead of time, it could focus customer retention efforts only on these "high risk" clients. The ultimate goal is to expand its coverage area and retrieve more customers loyalty. The core to succeed in this market lies in the customer itself.
Customer churn is a critical metric because it is much less expensive to retain existing customers than it is to acquire new customers.
To detect early signs of potential churn, one must first develop a holistic view of the customers and their interactions across numerous channels.As a result, by addressing churn, these businesses may not only preserve their market position, but also grow and thrive. More customers they have in their network, the lower the cost of initiation and the larger the profit. As a result, the company's key focus for success is reducing client attrition and implementing effective retention strategy.
- Finding the % of Churn Customers and customers that keep in with the active services.
- Analysing the data in terms of various features responsible for customer Churn
- Finding a most suited machine learning model for correct classification of Churn and non churn customers.
- Customers who left within the last month – the column is called Churn
- Services that each customer has signed up for – phone, multiple lines, internet, online security, online backup, device protection, tech support, and streaming TV and movies
- Customer account information – how long they’ve been a customer, contract, payment method, paperless billing, monthly charges, and total charges
- Demographic info about customers – gender, age range, and if they have partners and dependents
Libraries: sklearn, Matplotlib, pandas, seaborn, and NumPy
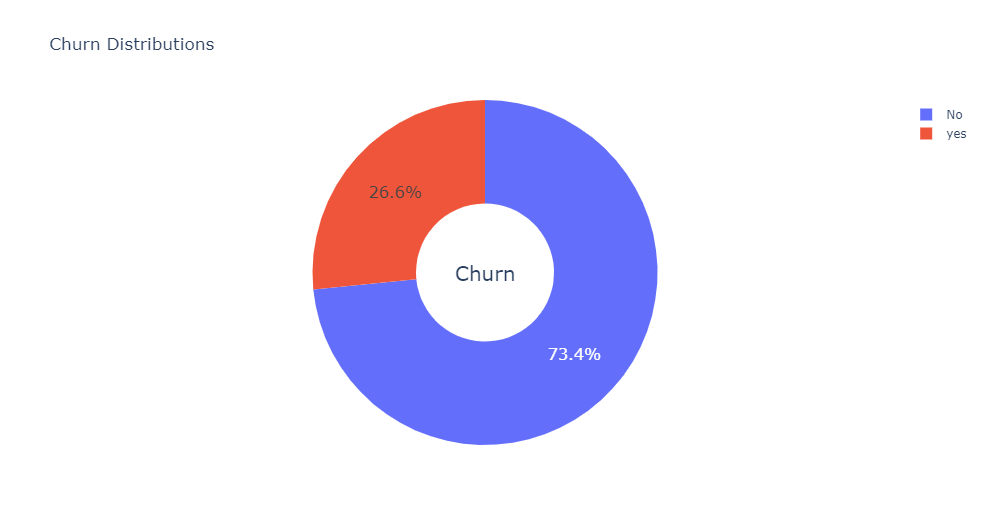
26.6 % of customers switched to another firm.

There is negligible difference in customer percentage/count who chnaged the service provider. Both genders behaved in similar fashion when it comes to migrating to another service provider/firm.`
About 75% of customer with Month-to-Month Contract opted to move out as compared to 13% of customrs with One Year Contract and 3% with Two Year Contract


Major customers who moved out were having Electronic Check as Payment Method. Customers who opted for Credit-Card automatic transfer or Bank Automatic Transfer and Mailed Check as Payment Method were less likely to move out.
Several customers choose the Fiber optic service and it's also evident that the customers who use Fiber optic have high churn rate, this might suggest a dissatisfaction with this type of internet service. Customers having DSL service are majority in number and have less churn rate compared to Fibre optic service.

Customers without dependents are more likely to churn.

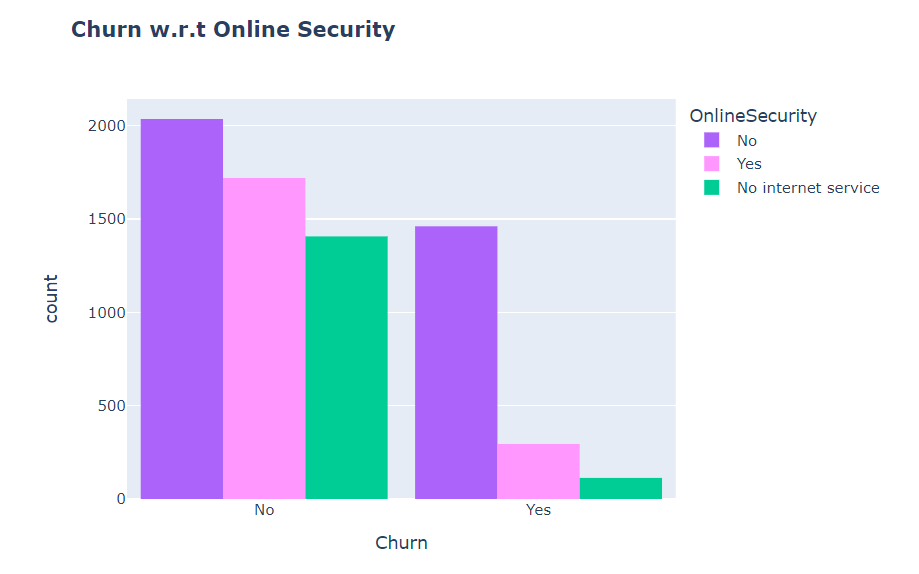
As shown in following graph, most customers churn due to lack of online security
Most of the senior citizens churn; the number of senior citizens are very less in over all customer base.

Customers with Paperless Billing are most likely to churn.

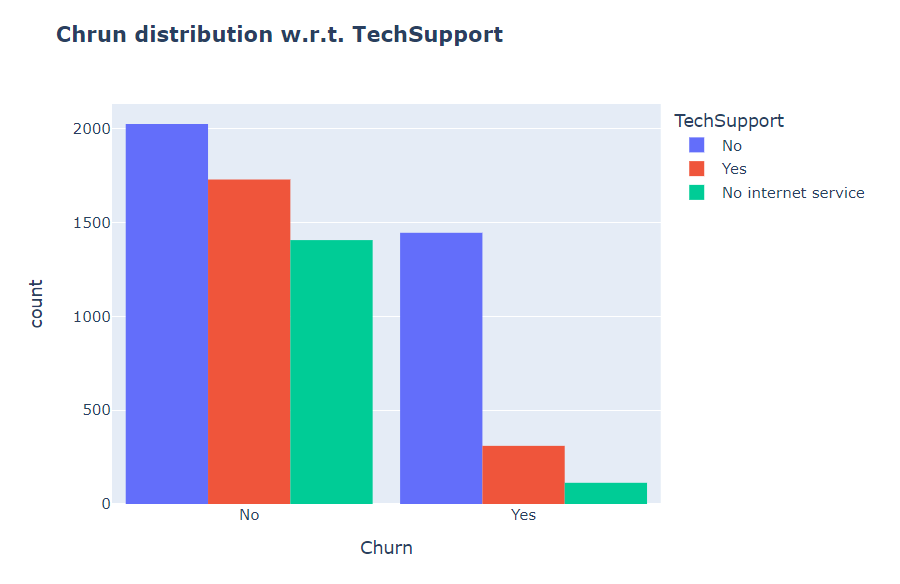
As shown in following chart, customers with no TechSupport are most likely to migrate to another service provider.


Customers with higher Monthly Charges are also more likely to churn.
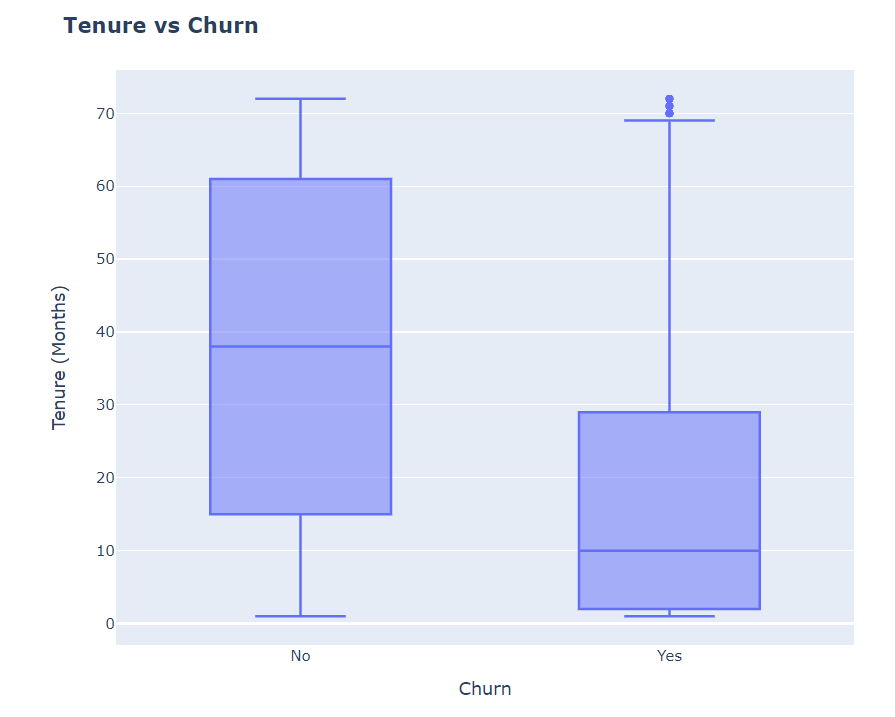
New customers are more likely to churn.


- We have selected Gradient boosting, Logistic Regression, and Adaboost for our Voting Classifier.
    from sklearn.ensemble import VotingClassifier
    clf1 = GradientBoostingClassifier()
    clf2 = LogisticRegression()
    clf3 = AdaBoostClassifier()
    eclf1 = VotingClassifier(estimators=[('gbc', clf1), ('lr', clf2), ('abc', clf3)], voting='soft')
    eclf1.fit(X_train, y_train)
    predictions = eclf1.predict(X_test)
    print("Final Accuracy Score ")
    print(accuracy_score(y_test, predictions))
Final Score
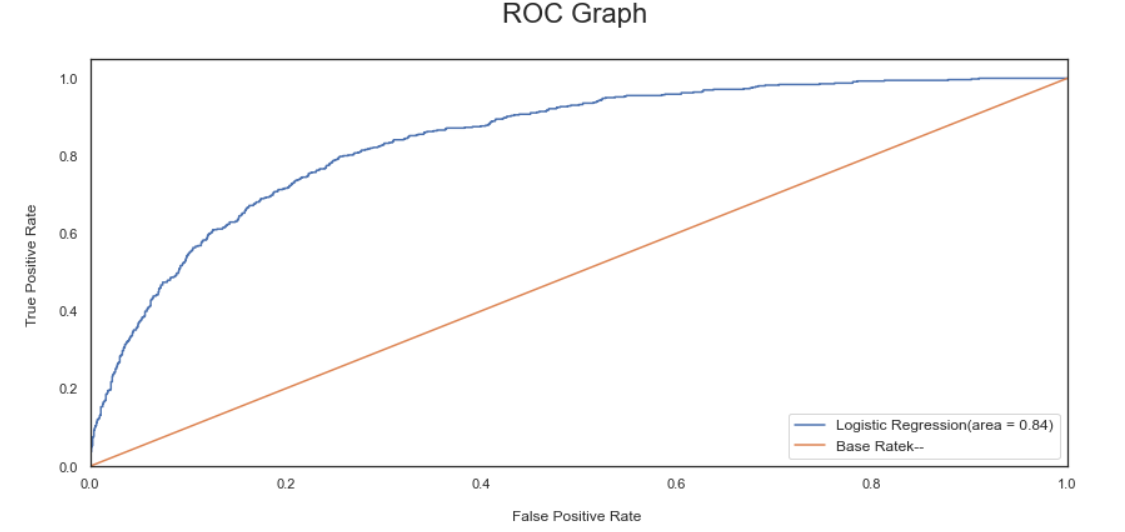
{'LogisticRegression': [0.841331397558646, 0.010495252078550477],
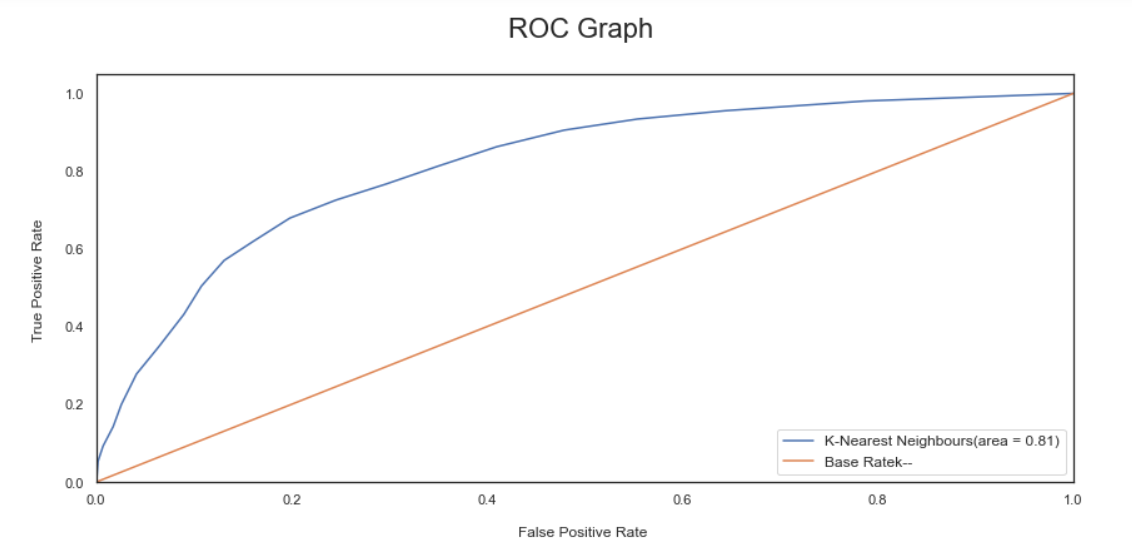
'KNeighborsClassifier': [0.7913242024807321, 0.008198993337848612],
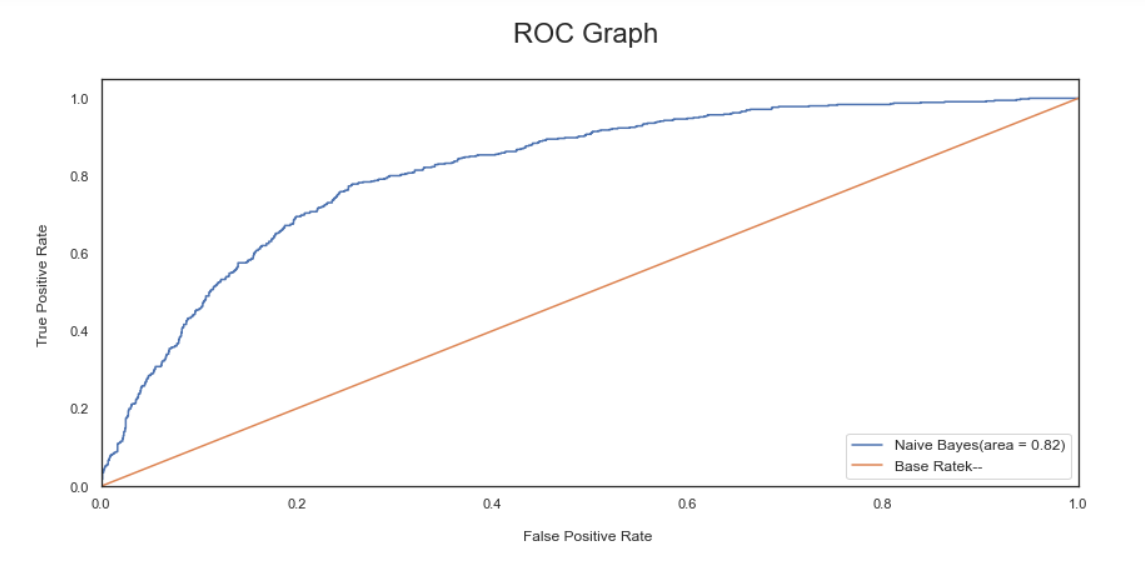
'GaussianNB': [0.8232386881685605, 0.00741678015498337],
'DecisionTreeClassifier': [0.6470213137060805, 0.02196953973039052],
'RandomForestClassifier': [0.8197874155380965, 0.011556155864106703],
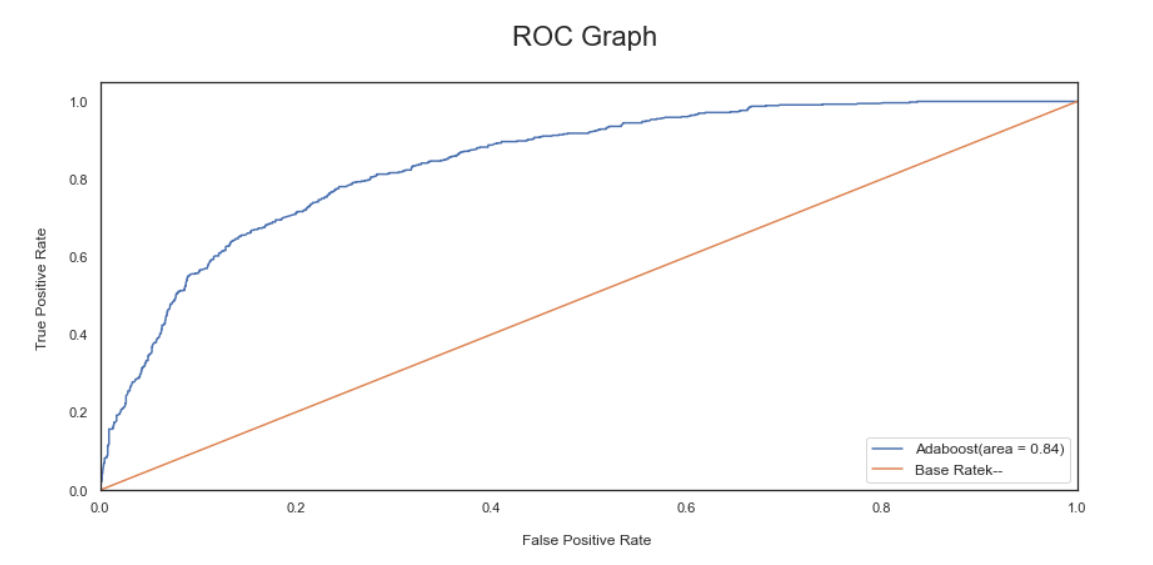
'AdaBoostClassifier': [0.8445838813774079, 0.01125665302188384],
'GradientBoostingClassifier': [0.844630629931458, 0.010723107447558198],
'VotingClassifier': [0.8468096379573085, 0.010887508320460332]}
- Final confusion matrix we got:

From the confusion matrix we can see that: There are total 1383+166=1549 actual non-churn values and the algorithm predicts 1400 of them as non churn and 149 of them as churn. While there are 280+280=561 actual churn values and the algorithm predicts 280 of them as non churn values and 281 of them as churn values.
We could use Hyperparamete Tuning or Feature enginnering methods to improve the accuracy further.
If you have any feedback, please reach out at pradnyapatil671@gmail.com
I am an AI Enthusiast and Data science & ML practitioner
![]()
![]()
![]()
![]()