Skip to content
New issue

Have a question about this project? Sign up for a free GitHub account to open an issue and contact its maintainers and the community.

By clicking “Sign up for GitHub”, you agree to our terms of service and privacy statement. We’ll occasionally send you account related emails.

Already on GitHub? Sign in to your account

Fix num_years_to_plot in output_plots.plot_all #757

Closed
jdebacker opened this issue Oct 30, 2021 · 4 comments
Closed

Fix num_years_to_plot in output_plots.plot_all #757

jdebacker opened this issue Oct 30, 2021 · 4 comments

Comments

@jdebacker
Copy link
Member

jdebacker commented Oct 30, 2021

Several of the plots in output_plots.plot_all assume that the time path is at least 150 periods (see here). This causes issues if a user sets T to a value less than 150.

A solution to this would be to replace num_years_to_plot=150 to num_years_to_plot=min(base_params.T, 150).

@sebastiansajie
Copy link

@jdebacker
I have made the following changes to run_og_core_example.py to allow us to supply a different set of parameters to the example. I also included an option to send an email when the code has finished running.

image

image

image

This required changes in output_plots.py

image

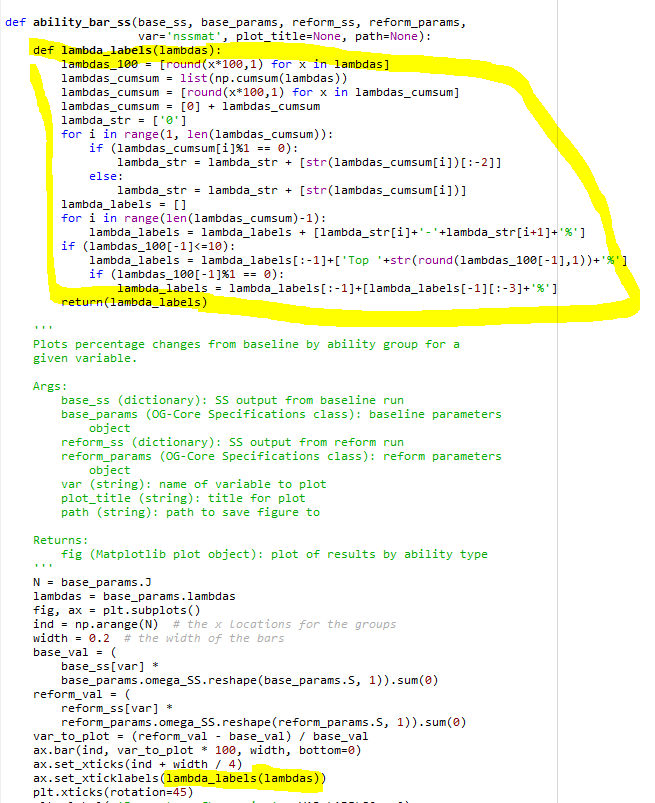
The ability_bar also needed to be changed as it was accessing constants.py to access the GROUP_LABELS for the bar plot which was hard coded. I created a function to generate the labels from the lambdas.

image

@jdebacker
Copy link
Member Author

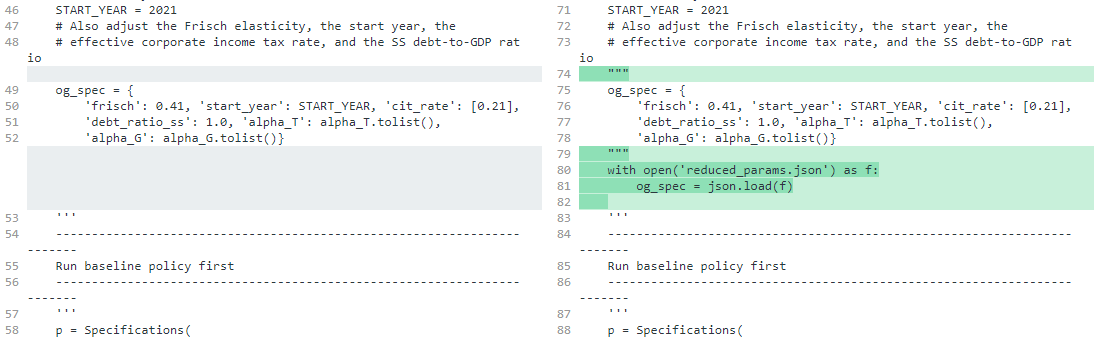
@sebastiansajie I like your fixes to the output_plots.py.plot_all() function and the lambda_labels (really creative solution there!). Thank you for proposing these.

I'd recommend adding the lambda_labels() function to utils.py as it it can then be imported and used in output_plots.py and parameter_plots.py (both of which currently import the GROUP_LABELS from constants.py and therefore have issues without J in [7, 9, 10].

I think the changes your propose to the example script are best left out of OG-Core for now. I like having the example script produce output with a more realistic calibration, even if it does take more time to run. You can just keep your modified script around for your own use (I have a bunch of these for different simulations I've run).

Let me know if you'd like to open a PR (here or at Revenue-Academy/OG-Core) or if you prefer, I can do it.

@sebastiansajie
Copy link

@jdebacker, I can open a PR for 1) updates to output_plots.py and 2) Making changes to utils.py (adding lambda_labels()) in OG-Core and then eventually syncing it to Revenue Academy.

@jdebacker
Copy link
Member Author

Addressed in PR #923.

Sign up for free to join this conversation on GitHub. Already have an account? Sign in to comment
Projects
None yet
Development

No branches or pull requests

2 participants