By:
- Vishnu Nair (@NairVish)
- Keith Low (@keithlowc)
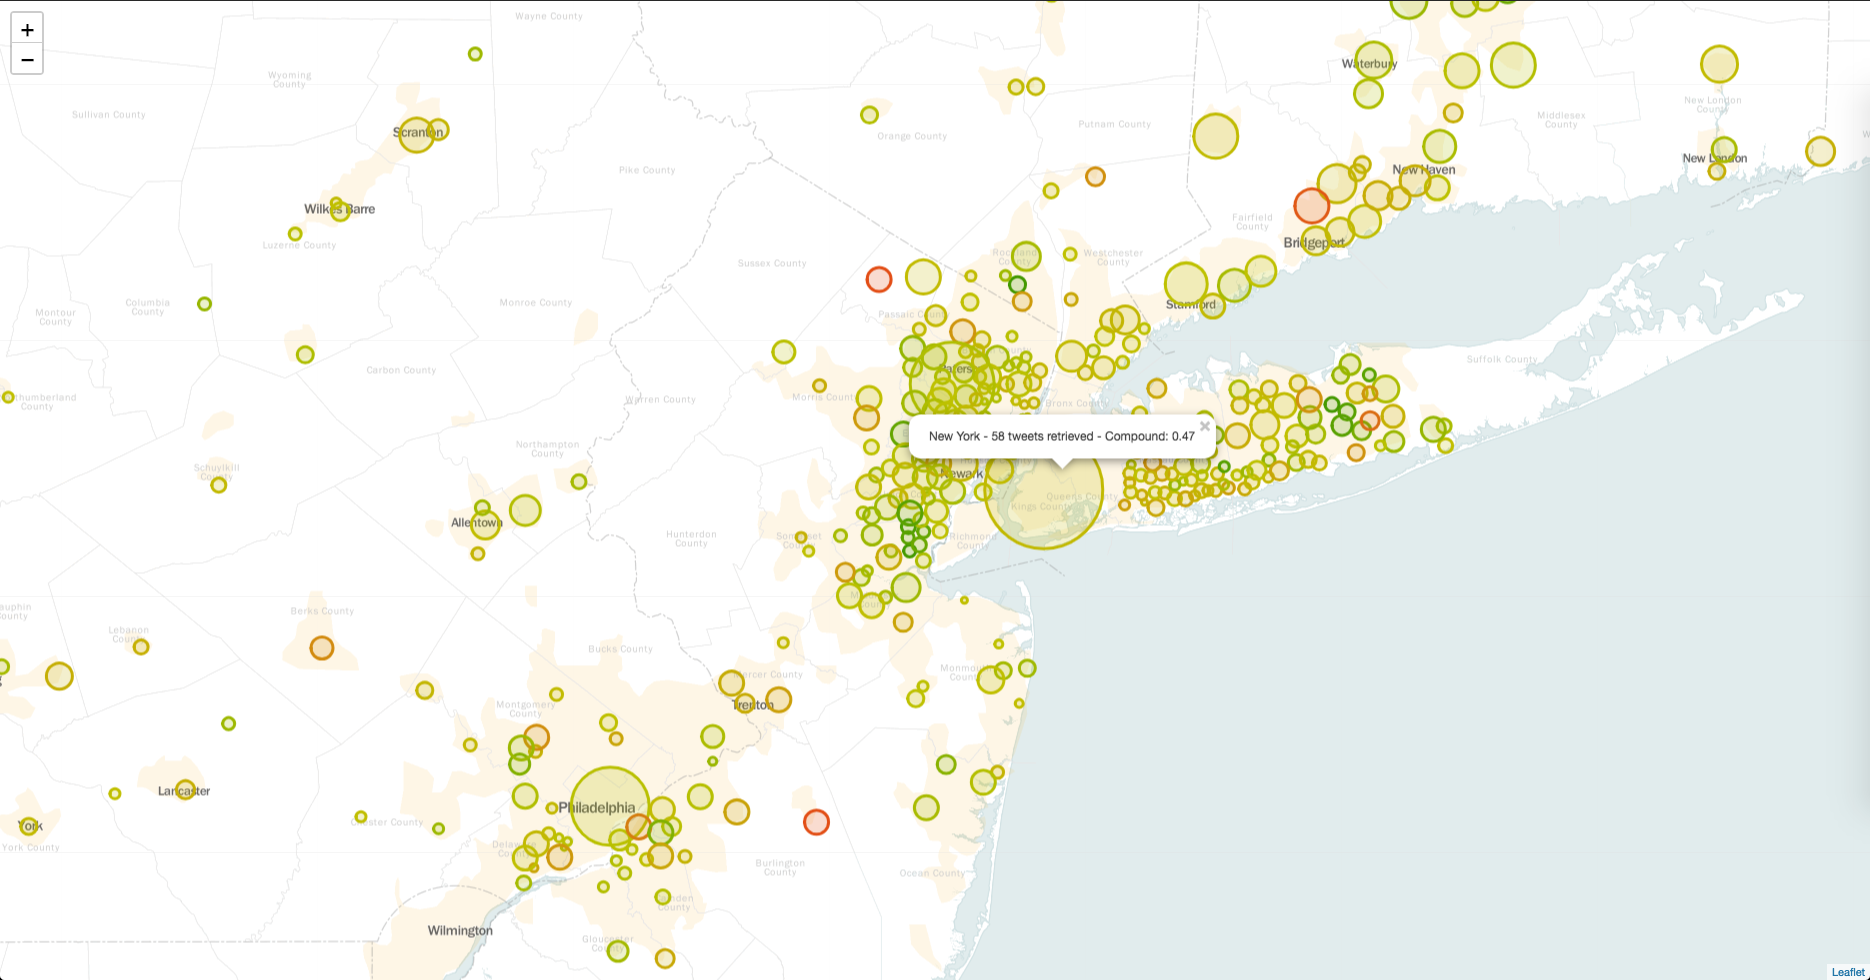
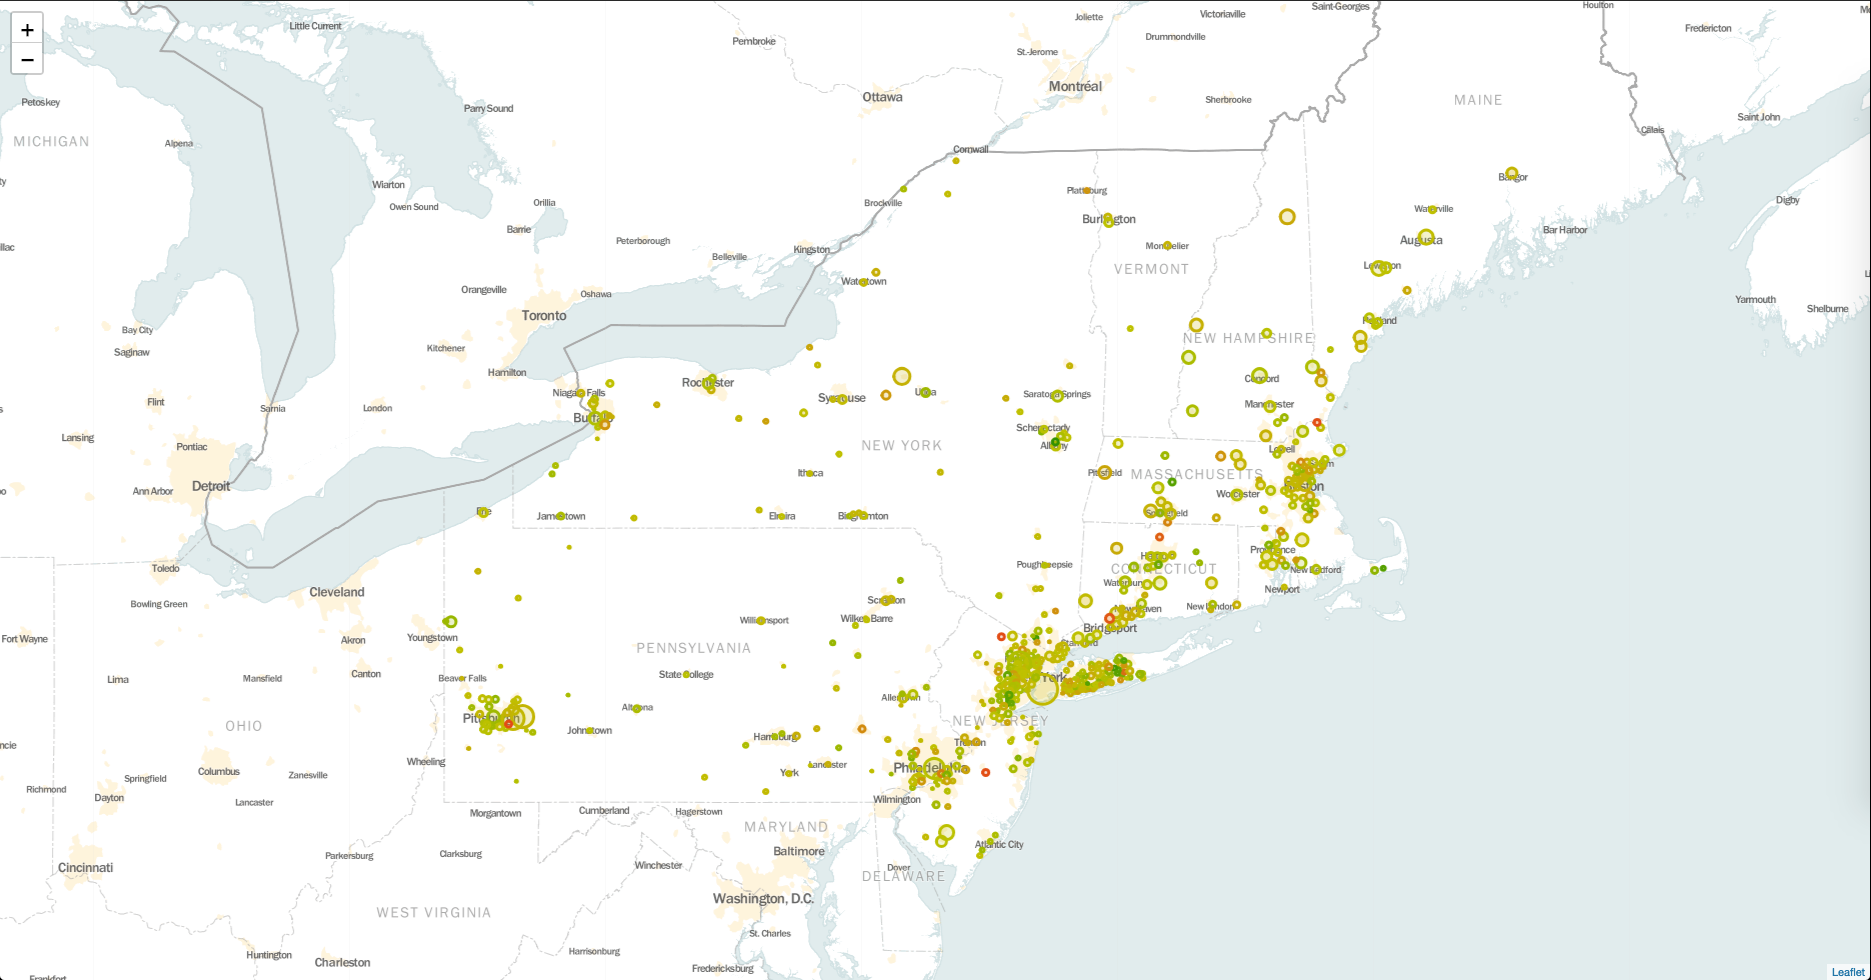
A series of scripts that downloads tweets for a list of cities (in this case, northeastern U.S. cities) using a particular query, cleans them, computes an average sentiment for each city's tweets, and plots these average sentiment scores on a bubble map of the northeastern U.S.
The following sentiment maps were created using tweets pulled during the evening of October 6, 2018 using the query "trump."
Metro NYC area
Northeast U.S. (PA, NJ, NY, CT, RI, MA, VT, NH, ME)
The actual heatmap output for the above query can be found here.
shp_to_csv.py: Forms the list of cities to get tweets for by parsing shapefile data from the USGS and Gazetteer data from the U.S. Census Bureau. The output is a CSV file of all of the cities and their respective states, lat/lons, and size.- Specifically, we use the ESRI northeast cities shapefiles for the Long Island Sound ArcView project area
from the U.S. Geological Survey to get a list of cities in the Northeast, and the 2010 Census Gazetteer Files from the U.S. Census
Bureau (specifically
placesdata for each of the states in question) to get each city's size. - From the above processing, we attempt to get data for a total of 606 cities/towns/etc.
- Specifically, we use the ESRI northeast cities shapefiles for the Long Island Sound ArcView project area
from the U.S. Geological Survey to get a list of cities in the Northeast, and the 2010 Census Gazetteer Files from the U.S. Census
Bureau (specifically
grab_data.py: Connects to the Twitter API (standard tier) to grab tweets for each specified city.keys.pyholds the appropriate API keys.- To allow for quick processing, we only download up to 100 tweets. (Though, of course, more will be useful.)
json_parser.py: Cleans the tweet data (links, some special characters, etc.) and removes duplicates.analyze_data.py: Computes sentiments on the cleaned tweet data (using VADER Sentiment Analysis), plots them on a bubble map (using Folium), and saves the resultant map in an html file.main.py: A simple script that executes almost all of the above in one go.

