Highlights
Box plot
Added a new plot type: box plot. It's useful to visualise a distribution when you have a set of values for each sample.
from multiqc.plots import box
self.add_section(
    ...,
    plot=box.plot(
        {
            "sample 1": [4506, 4326, 3137, 1563, 1730, 3254, 2259, 3670, 2719, ...],
            "sample 2": [2145, 2011, 3368, 2132, 1673, 1993, 6635, 1635, 4984, ...],
            "sample 3": [1560, 1845, 3247, 1701, 2829, 2775, 3179, 1724, 1828, ...],
        },
        pconfig={
            "title": "Iso-Seq: Insert Length",
        },
    )
)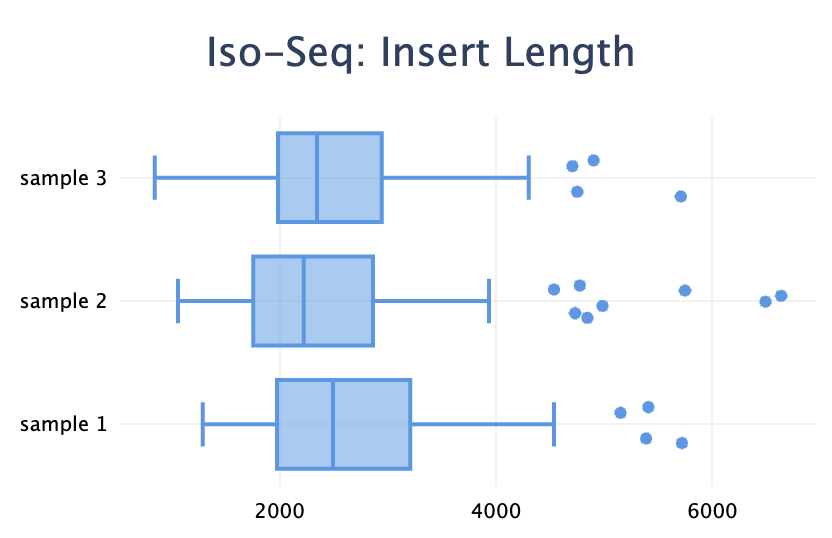
Note the difference with the violin plot: the box plot visualises the distributions of many values within one sample, whereas the violin plot shows the distribution of one metric across many samples.
pyproject.toml
The setup.py file has been superseded by pyproject.toml for the build configuration.
Note that now for new modules, an entry point should be added to pyproject.toml instead of setup.py, e.g.:
[project.entry-points."multiqc.modules.v1"]
afterqc = "multiqc.modules.afterqc:MultiqcModule"
Heatmap
The heatmap plot now supports passing a dict as input data, and also supports a zlab
parameter to set the label for the z-axis:
from multiqc.plots import heatmap
self.add_section(
    ...,
    plot=heatmap.plot(
        {
            "sample 1": {"sample 2": 0, "sample 3": 1},
            "sample 2": {"sample 1": 0, "sample 3": 0},
            "sample 3": {"sample 1": 1, "sample 2": 0, "sample 3": 1},
        },
        pconfig={
            "title": "Sample comparison",
            "zlab": "Match",
        },
    )
)
MultiQC updates
- New plot type: box plot (#2358)
- Add "Export to CSV" button for tables (#2394)
- Replace
setup.pywithpyproject.toml(#2353) - Heatmap: allow a dict dicts of data (#2386)
- Heatmap: add
zlabconfig parameter. Showxlab,ylab,zlabin tooltip (#2387) - Warn if
run_modulescontains a non-existent module (#2322) - Catch non-hashable values (dicts, lists) passed as a table cell value (#2348)
- Always create JSON even when MegaQC upload is disabled (#2330)
- Use generic font family for Plotly (#2368)
- Use a padded span with
nowrapinstead of before suffixes in table cells (#2395) - Refactor: fix unescaped regex strings (#2384)
Fixes:
- Pin the required Plotly version and add a runtime version check (#2325)
- Bar plot: preserve the sample order (#2339)
- Bar plot: fix inner gap in group mode (#2321)
- Violin: filter
Infvalues (#2380) - Table: Fix use of the
no_violin(ex-no_beeswarm) table config flag (#2376) - Heatmap: prevent from parsing numerical sample names (#2349)
- Work around call of
full_figure_for_developmentto avoid Kaleido errors (#2359) - Auto-generate plot
idwhenpconfig=None(#2337) - Fix: infinite
dmaxordminfail JSON dump load in JavaScript (#2354) - Fix: dump
pconfigfor MegaQC (#2344)
New modules
- IsoSeq
- Iso-Seq contains the newest tools to identify transcripts in PacBio single-molecule sequencing data (HiFi reads).
clusterandrefinecommands are supported.
- Iso-Seq contains the newest tools to identify transcripts in PacBio single-molecule sequencing data (HiFi reads).
- Space Ranger
- Works with data from 10X Genomics Visium. Processes sequencing reads and images created using
the 10x Visium platform to generate count matrices with spatial information. - New MultiQC module parses Space Ranger quality reports.
- Works with data from 10X Genomics Visium. Processes sequencing reads and images created using
Module updates
- bcl2fastq: fix the top undetermined barcodes plot (#2340)
- DRAGEN: add few coverage metrics in general stats (#2341)
- DRAGEN: fix showing the number of found samples (#2347)
- DRAGEN: support
gvcf_metrics(#2327) - fastp: fix detection of JSON files (#2334)
- HTSeq Count: robust file reading loop, ignore
.parquetfiles (#2364) - Illumina InterOp Statistics: do not set
'scale': Falseas a default (#2350) - mosdepth: fix regression in showing general stats (#2346)
- Picard: Crosscheck Fingerprints updates (#2388)
- add a heatmap for LOD scores besides a table
- if too many pairs in table, skip those with
Expectedstatus - use the
warnstatus forInconclusive - add a separate sample-wise table instead of general stats
- sort tables by status, not by sample name
- add a column "Best match" and "Best match LOD" in tables
- hide the LOD Threshold column
- PURPLE: support v4.0.1 output without
versioncolumn (#2366) - Samtools: support new
coveragecommand (#2356) - UMI-tools: support new
extractcommand (#2296) - Whatshap: make robust when a stdout is appended to TSV (#2361)
New Contributors
Full Changelog: v1.20...v1.21
Contributors
grst