CONTENT OF THIS REPOSITORY
- R scripts to replicate the methodological section included in the paper about single cell sequencing data
DESCRIPTION OF WORKFLOW
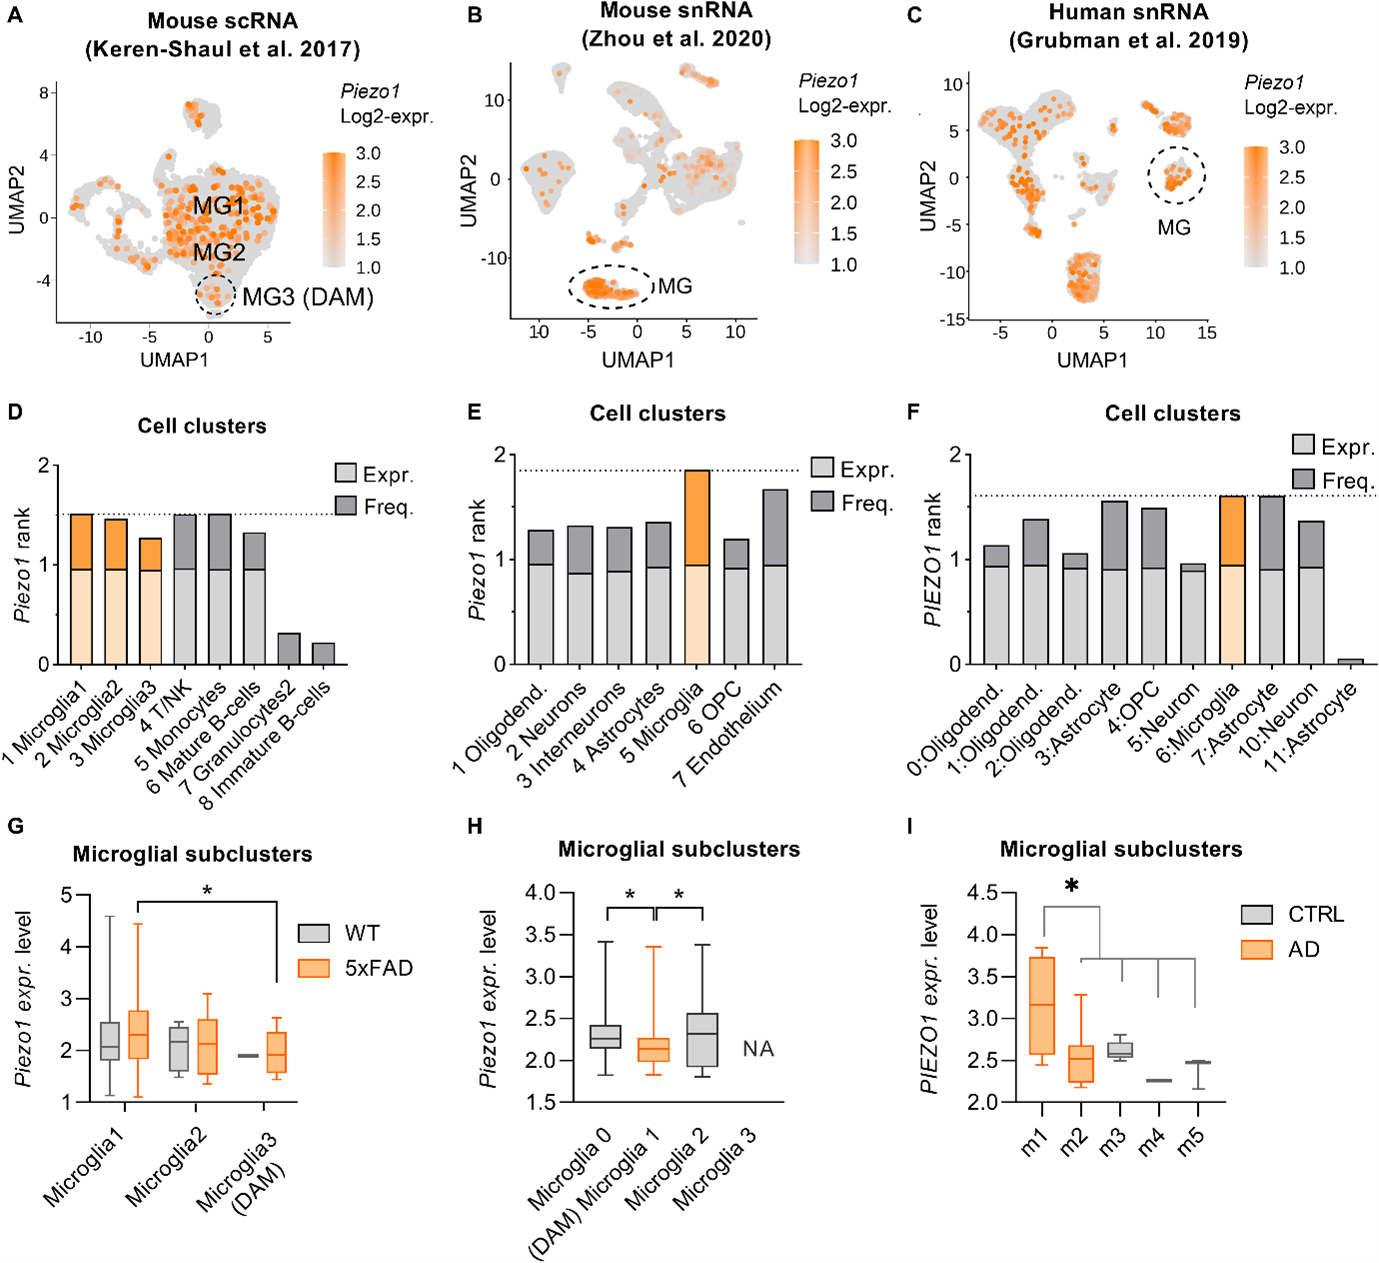
Analysis of Piezo1 in Grubman’s et al. snRNA, Keren-Shaul’s et al. scRNA and Zhou’s et al scRNA datasets. Seurat [3] was used for the analysis of the snRNA Grubman’s et al. snRNA, Keren-Shaul’s et al. scRNA and Zhou’s et al datasets as described in the method “QC and pre-processing”, “Dimension reduction”, “Clustering” and “Differential expression” sections. A small exception has been made for Zhou’s et al data. For this latter, we removed the cells identified as multiplets by performing the scds method [17] and removing the cells which obtained a score greater than 0.35. Proceeding with the Seurat workflow for all the data, a gene was kept if belonging to at least 3 cells, while a cell was kept if owning at least 200 expressed genes. This step allows to remove unlikely to be informative data and to improve the precision of the scRNA/snRNA analysis [4]. The cells which had a percentage of mitochondrial genes greater than 5% were filtered out because possible dying cells [5]. A further filtering has been performed following the original authors of the data based on the number of UMI and of genes per cell. After this preliminary processing, data were normalized to reduce technical differences which can dominate the downstream analysis [6], scaled to remove the influence of gene expression magnitude on gene variance [4] and clustered. PCA and JackStraw procedures were applied based on the 2000 most variable genes to improve the clustering resolution [7]. The percentage of variance explained by each principal component was plotted and the number of principal components was then chosen at the ‘elbow’ of the plot where a substantial drop was observed. The first 20 PCA components ensured the best separation of the cells and clusters have been detected with a resolution equal to 0.32 for the Grubman’s et al. dataset, while 0.2 for Keren-Shaul’s and 0.06 for Zhou’s data. Finally, the clusters annotation in specific cell-types was addressed using scCATCH [8] for the human dataset while using gene set variation analysis (GSVA) [14] for the mouse ones. About the scCATCH approach, it gets the marker genes of each cluster, it matches the markers with cell-type specific literature-based genes collected in the cell taxonomy reference database (CellMatch [9,10,11] and computes an evidence-based score. The cluster is annotated based on which cell-type specific literature-based genes got the highest score. About the GSVA, it is a non-parametric, unsupervised method for the gene set enrichment analysis. As tested by J. Javier et al. [15], the method allows to estimate the cell type of a cluster when the pathways are defined as sets of cell-type specific literature-based genes. We aggregated the cells belonging to each cluster with the mean of their gene expression and computed the GSVA enrichment score. For the Keren-Shaul’s et al. dataset, we defined the cell-type specific literature-based genes based on the most expressed genes of each cell population already annotated in the author’s publication. While for the Zhou’s et al dataset, we used the cell-type specific literature-based genes detected by the authors and associated to their specific clusters. The overall pipeline with some changes has been applied also to get the Grubman’s et al. and Zhou’s et al microglia subpopulations which the corresponding authors defined and annotated associated to the control or Alzheimer disease patients. Specifically about the changes for the Grubman’s et al dataset, we filtered out cells having a percentage of mitochondrial genes greater than 2%, cells having a number of genes greater than 900 and of UMI greater than 1500 to remove potential outsiders. We applied JackStraw with only the first 5 PCA components and clustering with a resolution parameter equal to 0.90. We removed some further outlier cells manually using the UMAP visualization and the interactive Seurat mode. While for the Zhou’s et al dataset, we filtered out cells having a percentage of mitochondrial genes greater than 2%, cells having a number of genes greater than 1500 and of UMI greater than 2000 to remove potential outsiders. We applied JackStraw with only the first 16 PCA components and clustering with a resolution parameter equal to 0.05. After the cell clustering, we proceeded with the annotation of the different microglia subpopulations according to the information provided by the authors regarding the differential expressed genes reported in the supplementary files. After the cell clustering and annotation, we proceeded to analyse the gene’s statistics in the clusters. We determined the ratio of frequency and of expression to understand the presence and the level of expression of each gene with respect the others (e.g. frequency ratio of 0.6 means that the gene appears expressed in more cells than 60% of the other genes in the same cell-type). We counted the number of cells expressing a gene, assessed its rank with respect to the frequency of all other genes (i.e. rank 1 for the lowest abundant gene) and normalized the ranks by the number of total genes in analysis (i.e. ratio of 0 for the cell-type specific lowest frequent gene, while 1 for the gene expressed in the highest number of cells). We repeated the same approach also with the gene normalized level of expression (e.g. ratio of 1 for the most expressed gene in a cell type). To conclude, we summarized the information retrieved for each gene. We defined a continuous score, from the minimum value of 0 to the maximum of 2, based on the sum of the ratio of frequency and the ratio of expression. For example, the gene which in a specific cell-type cluster is both the most frequent and the most expressed with respect the other genes gets a score equal to 2, while 0 otherwise. We then performed a correlation analysis between the DAM markers (Keren-Shaul’s et al. genes associated to Alzheimer disease-specific microglia) and Piezo1. We determined how much the DAM markers were correlating with their expression to Piezo1 expression in the mouse microglia subpopulations. In case of the Keren-Shaul’s et al data, we considered the gene expressions in the Microglia 1, 2 and 3. In case of the Zhou’s et al. data, we considered the gene expressions in the WT_5XFAD (declated DAM by the authors) and the microglia 0 and 2. We selected the DAM markers with a high correlation with Piezo1 and that were present in at least the 70% of the Piezo1 cells. We kept only the DAM markers satisfying the criteria in both the two mouse datasets.
- [1] Grubman, Alexandra et al. “A single-cell atlas of entorhinal cortex from individuals with Alzheimer's disease reveals cell-type-specific gene expression regulation.”, Nature neuroscience vol. 22,12 (2019)
- [2] Keren-Shaul, Hadas et al. A Unique Microglia Type Associated with Restricting Development of Alzheimer’s Disease, Cell, Volume 169, Issue 7
- [3] Butler et al. Integrating single-cell transcriptomic data across different conditions, technologies, and species. Nat. Biotechnol. 36, 411–420 (2018)
- [4] Wu, Y., Zhang, K. Tools for the analysis of high-dimensional single-cell RNA sequencing data. Nat Rev Nephrol (2020). **
- [5] Potter, S. S. Single-cell RNA sequencing for the study of development, physiology and disease. Nat. Rev. Nephrol. 14, 479–492 (2018).
- [6] Vallejos, C. A., Risso, D., Scialdone, A., Dudoit, S. & Marioni, J. C. Normalizing single-cell RNA sequencing data: challenges and opportunities. Nat. Methods 14, 565–571 (2017).
- [7] Yip, S. H., Sham, P. C. & Wang, J. Evaluation of tools for highly variable gene discovery from single-cell RNA-seq data. Brief. Bioinform. 20, 1583–1589 (2018).
- [8] Xin et al. scCATCH: Automatic Annotation on Cell Types of Clusters from Single-Cell RNA Sequencing Data. iScience vol. 23,3 (2020)
- [9] Yuan, Huating et al. “CancerSEA: a cancer single-cell state atlas.” Nucleic acids research vol. 47,D1 (2019)
- [10] Han, Xiaoping et al. “Mapping the Mouse Cell Atlas by Microwell-Seq.” Cell vol. 172,5 (2018)
- [11] Zhang, Xinxin et al. “CellMarker: a manually curated resource of cell markers in human and mouse.” Nucleic acids research vol. 47,D1 (2019)
- [12] Paz-Y-Miño, César A et al. “Positive Association of the Cathepsin D Ala224Val Gene Polymorphism With the Risk of Alzheimer's Disease.” The American journal of the medical sciences vol. 350,4 (2015)
- [13] Pottier, Cyril et al. “TYROBP genetic variants in early-onset Alzheimer's disease.” Neurobiology of aging vol. 48 (2016)
- [14] Hänzelmann S, Castelo R, Guinney J. “GSVA: gene set variation analysis for microarray and RNA-Seq data.” BMC Bioinformatics
- [15] J. Javier, Meng et al. ”Evaluation of methods to assign cell type labels to cell clusters from single-cell RNA-sequencing data”. F1000Research 2019
- [16] Zhou, Yingyue et al. “Human and mouse single-nucleus transcriptomics reveal TREM2-dependent and TREM2-independent cellular responses in Alzheimer's disease.” Nature medicine (2020):
- [17] Bais, Abha S, and Dennis Kostka. “scds: computational annotation of doublets in single-cell RNA sequencing data.” Bioinformatics (2020)
DESCRIPTION OF EACH FILE AND SUBDIRECTORY
-
/op1_PIEZO1_summary_stats.R R script which summarizes the results computed in the single datasets about Piezo1
-
/Grubman_hsa_v2/op1_scRNA_analysis.R R script which summarizes the results computed in the single datasets about the correlation between Piezo1 and the DAM markers in Shaul dataset
-
/Grubman_hsa_v2/op1_scRNA_analysis.R Clustering and annotation of Grubman's human scRNA data
-
/Grubman_hsa_v2/op1_scRNA_PIEZO1_plot1 and 2.R Perform PIEZO1 analysis and produces the plots and tables
-
/Shaul_mmu_v2/op1_data_preparation.R Prepare Keren-Shaul’s et al. scRNA data
-
/Shaul_mmu_v2/op2_scRNA_analysis.R Clustering and annotation of Keren-Shaul’s et al. scRNA data
-
/Shaul_mmu_v2/op2_scRNA_PIEZO1_plot1.R Perform PIEZO1 analysis and produces the plots and tables
-
/Shaul_mmu_v2/op3_DAM_analysis.R Compare Piezo1 with DAM genes in microglia1, microglia2 and 3 (DAM cluster)
-
/Zhou_mmu/op1_data_preparation.R Prepare Zhou’s et al. snRNA data
-
/Zhou_mmu/op2_scRNA_analysis.R Clustering and annotation of Zhou’s et al. snRNA data
-
/Zhou_mmu/op2_scRNA_PIEZO1_plot1.R Perform PIEZO1 analysis and produces the plots and tables
-
/Zhou_mmu/op4_scRNA_analysis.R Determine the subpopulations of microglia with clustering and annotated based on author's information
-
/Zhou_mmu/op4_scRNA_analysis.R Compare Piezo1 with DAM genes in microglia1, microglia2 and 3 (DAM cluster)
-
/Zhou_mmu/op4_scRNA_PIEZO1_plot1.R Piezo1 analysis and results of its profile in the microglia subpopulations
-
/Zhou_mmu/op5_DAM_analysis.R Compare Piezo1 with DAM genes in microglia0, microglia2 and 1 (DAM cluster)