
TetraColourSpace is a 3D graph program for visualising data points a tetrachromatic colourspace. It was originally created to be used in conjunction with the R package pavo, as pavo's built-in 3D graph had very limited functionality (and annoying controls).
Datasets containing information about data points are loaded from XML-files and displayed within the confines of a tetrahedron (representing a tetrachromatic colourspace). An R-script with functions for generating correctly formatted XML-files from pavo's colspace objects (or data frames containing theta, phi and magnitude values) is included in the R folder.
| Data points | Data volumes | Colour metrics | Customisation |
|---|---|---|---|
 |
 |
 |
 |
- Visualise groups of data points within a tetrachromatic colour space.
- Colour the data points individually.
- Use different 3D-models for different data sets.
- Visualise volumes filled by data points.
- Display simple legends (by data point or group).
- Move the camera around freely and intuitively.
- Lock the camera towards a point (or the achromatic centre) to rotate around it.
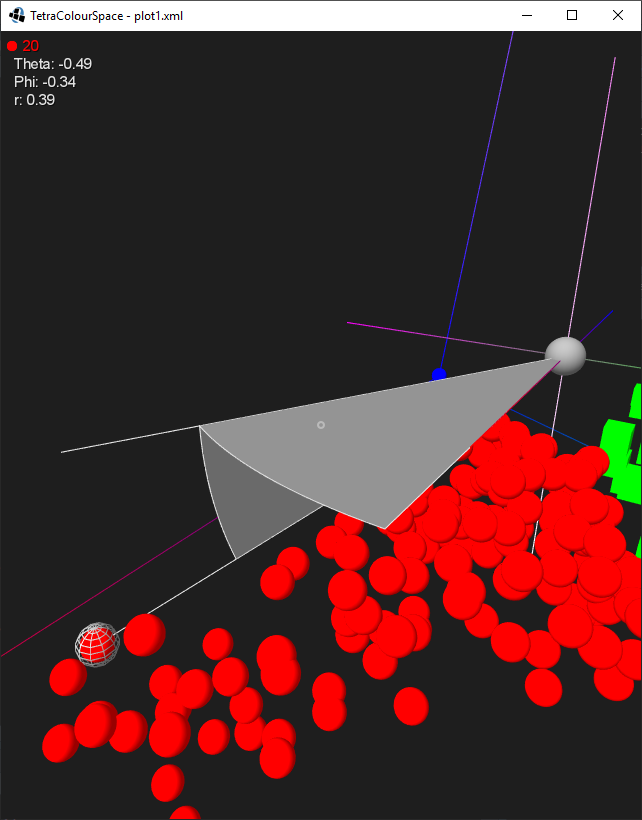
- Select points to display their names and colour metrics (theta, phi and r).
- Show or hide graph elements:
- The points and volumes (separately)
- The selected point's metrics
- The legend
- The axes
- The crosshair
- Change the tetrahedron between a wire-frame and semi-transparent shape.
- Customise the colours of graph elements:
- The background
- The colourspace tetrahedron's corners and achromatic centre
- Text
- The metric visualisation
- The crosshair
- The highlight and selection
- Configurable key bindings.
- Two rendering modes.
- Slow: Uses less memory, but struggles with large data sets (10000-100000+ points).
- Fast: Uses more memory, but handles large data sets.
- Take screenshots from within the program.
Download a pre-built version
- Download an existing release.
- Extract the .zip archive.
Or build the latest version using Gradle
- Clone the repository.
- Open a command prompt and navigate to the repository's root folder.
- Run
gradlew.bat desktop:distorgradlew desktop:dist. Requires a JDK. - Find the .zip archive with the runnable .jar in
desktop/build/distributions.
- Run the .jar file using
javaw -jar TetraColourSpace-[VERSION].jar <xml-file> [screenshot-folder].
xml-fileis a path to the graph XML-file to load.screenshot-folderis a path to a folder to store screenshots in (defaults to/output).
Creating new graphs
- Source
R/tcs_plot.Rinto your R session. - Start building a plot by calling
tcs.begin(). Use the (optional) parameters to configure the graph. - Use
tcs.points(),tcs.volumes()andtcs.volume()to add points and volumes to the graph. - Use
tcs.end()to save the graph file. If you specify the location of TetraColourSpace (usingjarPath), TetraColourSpace will launch and display the graph.
Displaying existing graphs
- Use
tcs.launch()to launch TetraColourSpace and display an existing graph. - Or, launch it manually from a command prompt/terminal according to the instructions above.
Other information
- Use
async = TRUEintcs.end()ortcs.launch()to allow execution of other R commands while TetraColourSpace is running.
TetraColourSpace loads graphs from XML-files. The basic format for these files is outlined below. Point positions are given as theta, phi, magnitude. More details can be found in XML_FORMAT.md.
<?xml version="1.0"?>
<data>
  <group name="Group1" shape="sphere">
    <point name="Point1" colour="#FFFFFF" position="-0.33,-0.41,0.51"/>
  </group>
  <volume colour="#FF0000">
  -0.33,-0.41,0.51
  -0.34,-0.39,0.49
  -0.38,-0.34,0.29
  -0.23,-0.60,0.22
  </volume>
</data>
Key bindings are set using a config.ini file, placed next to the .jar-file. See desktop/config.ini for a list of all commands. Available key-codes can be found here: LibGDX key strings.
If the config file is missing, the following defaults are used:
Free camera control
W/A/S/D: forward, backward, left and right along the XZ-planeSpace/Ctrl: up and downE/Q: move in/out (i.e. in the direction the camera is looking)Right mouse (drag): rotate the cameraShift: reduce movement speedLeft mouse (click): select highlighted point
Locking the camera
F: toggle lock towards the current selectionG: toggle lock towards the achromatic centre/originHome: hold to lock towards the achromatic centre/origin
Locked camera controls
A/D/Space/Ctrl: move left, right, up and down around the focal pointW/E/S/Q/mouse wheel: move towards/away from the focal pointRight mouse (drag): rotate around the focal pointShift: reduce movement speed
Auto-rotation (only in locked camera mode)
R: toggle auto-rotation on/offR + *: reverse rotation directionR + +: increase rotation speedR + -: decrease rotation speedR + numpad 1-9: set rotation speed (1-9)
Toggle elements
H: toggle highlight1: toggle points2: toggle volumesT: toggle tetrahedron sidesY: toggle axesM: toggle metrics (requires selected point)C: toggle crosshairL: toggle legend
Other
F12: take screenshot
This program is free software as long as the terms of the GNU GPL v3 license (or later versions, at your option) are complied with. See LICENSE for the full license text.
I reserve the exclusive right to re-license the code.
Powered by
![]()