This repository houses a collection of Python scripts designed for comparative transcriptomics and phylotranscriptomics. Detailed usage instructions for most of these scripts are available on my blog, Juse's Blog.
To facilitate ease of use, this README profile includes comprehensive explanations.
If you have any other requests for editing or formalizing content, feel free to ask!
These scripts will be interpreted in alphabetical order by name.
- abbababa_test.py
- callCodeml.py
- de.py
- enrichment_plot.py
- free-ratio-calcu.py & free-ratio-omega.py
- generate_clade-defs.py
- get_sites.py
- id_modification.py
- longest_contig.py
- onego.py
- ortho_select.py
- OTU_replace.py
- phylopypruner_batch.py
- ref2spename.py
- sequence_con.py
- sliding_window.py
- trim_filter.py
This script executes an ABBA-BABA test utilizing phylogenetic tree data. It benchmarks against the species tree, extracting all conceivable quartets of species. The script methodically traverses each gene tree, tallying the occurrences of ABBA and BABA patterns. Subsequently, it calculates the D-statistic and conducts a Binomial test to assess statistical significance.
Please note that this may require a high confidence level in the species tree, and too many species will bring huge time overhead (Modify the script to use multi-threading if necessary).
Usage:
$ python abbababa_test.py -s speciestree.treefile -g dirofgenetree -o ./abbababatest.csvParameters:
-sthe species tree-gthe directory of gene trees (end with.treefile)-othe output file (default:./abbababatest.csv)
Example output:
| p1 | p2 | p3 | o | abba_count | baba_count | d_statistic | p_value | total_trees | abba_gene | baba_gene |
|---|---|---|---|---|---|---|---|---|---|---|
| x | x | x | x | 5 | 4 | 0.111111111 | 1 | 82 | OG0009150... | OG0009299... |
For positive selection detection in batches (PAML).
This script appears in blog post.
Usage:
$ python callCodeml.py pathofmsa treeFile numofcpuParameters:
pathofmsathe path of MSA file (PML format)treeFilethe path of species treenumofcputhe number of cpu used
All result files will be output in the folder starting with WorkingDir in the current directory, and statistics of all results will appear in result.tsv in this folder.
Example of result.csv:
| lnL1 | lnL2 | np0 | np1 | kappa | pvalue | |
|---|---|---|---|---|---|---|
| XP_027232673.1.paml.PML | -2280.164167 | -2280.164167 | 11 | 12 | 2.45436 | 1 |
A script for extracting DEGs written for files output by Trinity pipeline. If you want to change the screening criteria, you can make corresponding adjustments.
This script appears in blog post.
Usage:
$ python de.py xxx.DE_results DEG_up.txt DEG_down.txtThe output DEG_up.txt and DEG_down.txt are the lists of up-regulated and down-regulated DEGs respectively.
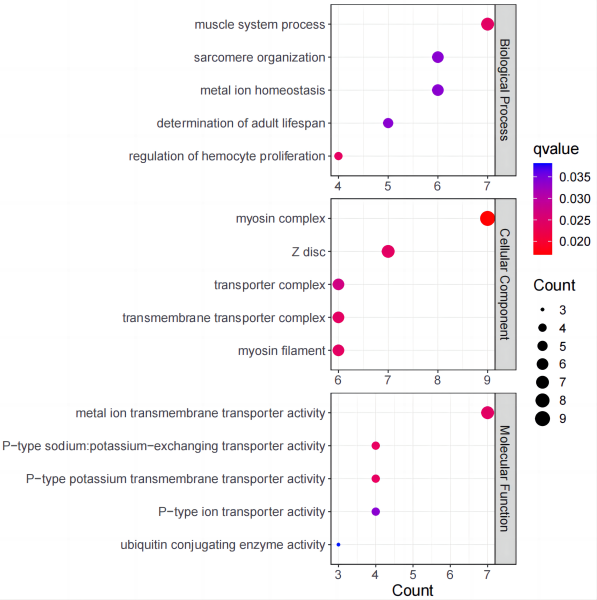
Pipeline for GO enrichment analysis and visualization (for transcriptome with no reference).
This script appears in blog post.
Usage 1:
$ python enrichment_plot.py -gef all_up.txt \
-geb onego.txt -go go_term.list \
-o outputdir \
#-t Juse -l 8 -w 8
Need:
-gefforeground gene sets used in the analysis, such as up- or down-regulated DEGs. e.g.
gene1
gene2
-gebbackground gene sets with go annotation. e.g.
gene1	GOxx1
gene1	GOxx2
gene2	GOxx1
......
-gogo_term.listin repository, can be generate by:
$ python get_go_term.py go-basic.obo
# go-basic.obo: https://purl.obolibrary.org/obo/go/go-basic.obo-ooutput directory
Optional:
-ttitle of figure-l-wlength and width of figure-yy label will be GO id if setID
Example output:

Usage 2:
$ python enrichment_plot.py -c enrichment_analysis.csv \
-o outputdir \
When using an existing csv for analysis.
Running free ratio model in batches.
This script appears in blog post.
$ python free-ratio_calcu.py treefile seqdir outputDirThe Parameters are same as callCodeml.py.
Summary the result:
$ python free-ratio-omega.py spename_file path_of_outfilespename_file (species whose ω(dN/dS) value needs to be collect):
SpeA
SpeB
SpeC
Example output:
File	A	B	C
1	0.00733407	0.0001	0.00574998
2	0.119151	0.0917734	0.0648513
3	0.0653332	0.0288158	0.0296085
Generate clade definition file for DiscoVista, need to use with Juse's fork.
$ python generate_clade-defs.py anno-1.txt anno.txtDetail: blog post.
Extract genomic CpG site coordinate information.
To run the example for extracting CpG sites located on chromosome 21 of the hg38 human genome, you would use the following command:
$ python get_sites.py -g hg38.fa -c chr21 --merge --gzip -n GRCh38-gspecifies the reference genome sequence file. The script is capable of automatically recognizing.gzcompressed format files.-cis used to specify the chromosome from which you want to extract site information. This should match the sequence id within the sequence file.--mergeis an optional flag that, when used, callsbedtoolsto merge the output files after the site information has been extracted. It's important to note that this option requiresbedtoolsto be installed and available in your environment path.--gzipcompresses the output files after the site information has been extracted (and merged, if--mergewas specified).-nallows you to specify a prefix for the output files. If not provided, the script defaults to using the prefix of the sequence file.-pspecifies the path where the output files will be saved. If this parameter is not given, the files are saved to the current working directory of the script.
Additionally:
- If the
--onlycpgflag is included in the command, the script will exclusively generate files for CpG site locations. - If the
--nosoftmaskflag is included in the command, the script will skip soft-masked region (Treat as N).
Modify the id in the fasta file.
This script appears in blog post.
$ python id_modification.py -m pre --string Human@ -o before.fasta -f after.fastabefore
>TRINITY_DN417604_c0_g1_i1
after
>Human@TRINITY_DN417604_c0_g1_i1
Choice of -m :
preadd prefixsufadd suffixsimsimplify id (remove comment of description of id)
This script should only be used for transcriptome assembly. Biopython is recommended for genome fasta sequences.
Extract the longest transcript from the Trinity assembly.
This script appears in blog post.
$ python longest_contig.py xxx.fasta longest.fastaNote that this script only works with Trinity output.
Convert Modelfinder results into a format that can be input into mrbayes. e.g.
$ iqtree2 -s concatenation_ortho.fasta \
-spp IQ_partition.txt \
-m TESTMERGEONLY -mset mrbayes \
-nt AUTO -pre mybayes_aa
This script appears in blog post.
$ python mf2mrbayes.py mybayes_aa.best_scheme.nexThe output Mrbayes_par.txt records the commands Mrbayes needs to type to specify partitioning and evolution models. e.g.
# mybayes_aa.best_scheme.nex
begin sets;
  charset OG0000874_OG0001754_OG0010164_OG0012298 = 1-125  8053-9358  52564-52667  71562-71712;
  ......
  charpartition mymodels =
    JTT+I+G4: OG0000874_OG0001754_OG0010164_OG0012298,
    ......
# Mrbayes_par.txt
charset subset1 = 1-125 8053-9358 52564-52667 71562-71712;
......
artition Names = 37:subset1, ......
set partition=Names;
lset applyto=(1) rates=invgamma;
prset applyto=(1) aamodelpr=fixed(jones);
......
Convert annotation files to one-to-one.
This script appears in blog post.
$ python onego.py go_annotation.txt onego.txtgo_annotation.txt:
xxx1 GO:0003674,GO:0005488
onego.txt:
xxx1      GO:0003674
xxx1      GO:0005488
Select orthogroup based on species number and sequence number. This script is designed for output of OrthoFinder but should be available for other situations.
This script appears in blog post.
Usage:
$ python ortho_select.py -l 30 -b 20 -f /pathto/OrthoFinder/Results_xxx/Orthogroup_Sequences -o ortho_seq-lspecifies the minimum number of species (>), this is to filter orthogroups containing inadequate species.-bmeans that when the number of species sequences is greater than this parameter, the OG will be regarded as a large OG (e.g.SpeAwith 21 sequences for above code)(<=), this is to split orthogroups that contain too much sequences (likely caused by excessive paralogs).-fis theOrthogroup_Sequencespath run by orthofinder-ois the output directory
In the above use case, this command will generate two folders, orthogroup_big and orthogroup_small, in the ortho_seq folder.
Replace sequence id (Spe_ to Spe@).
IQtree will replace @ with _ when building a tree, but some software only recognizes @ as a species identifier.
This script appears in blog post.
$ python OTU_replace.py dir species_listdirdirectory stores all sequence and tree files whose IDs need to be modifiedspecies_listeach line corresponds to a species name
Human
Mouse
Fish
Example:
# Before
>Human_xxxxxx
>Mouse_xxxxxxx
>Fish_xxxxxxxxx
# After
>Human@xxxxxx
>Mouse@xxxxxxx
>Fish@xxxxxxxxx
Running phylopypruner in batches avoids a recursion error, which has been deprecated since it was fixed via PR.
Convert sequence files in RefSeq format to sequence format starting with the species name.
This script appears in blog post.
$ python ref2spename.py ncbi_dataset/data/GCF_000001405.40/protein.faa human.fastaExample:
>NP_000005.3 alpha-2-macroglobulin isoform a precursor [Homo sapiens] # before
>Homo_sapiens@NP_000005.3_alpha-2-macroglobulin_isoform_a_precursor # after
Concatenate sequences and generate partition files for IQTREE using this script.
Note: This script uses @ as the species identifier. If your data utilizes _ as a species identifier, you can employ OTU_replace.py for conversion, or alternatively, modify this script to suit your requirements.
Please ensure to run the script in the directory containing the multiple sequence alignment files. Important: do not place the script or any unrelated files in this directory, as the script lacks suffix recognition capability.
This script appears in blog post.
$ python /pathto/sequence_con.pyUpon completion, a new folder con_res will be created. This folder includes the merged sequence file concatenation_ortho.fasta and the partition information file IQ_partition.txt, which are necessary for building trees in IQTREE.
Additionally, a log file sequence_con.log is generated, detailing the sequence length information for each species. In this log, a + in the last column indicates consistency with the first length for all species. A - sign, conversely, signals alignment errors in some species' sequences, denoting a length inconsistency.
For those seeking more comprehensive output information, consider downloading JuseKit, a software I developed based on PyQt5. It not only includes the sequence concatenation function but also provides more detailed output.
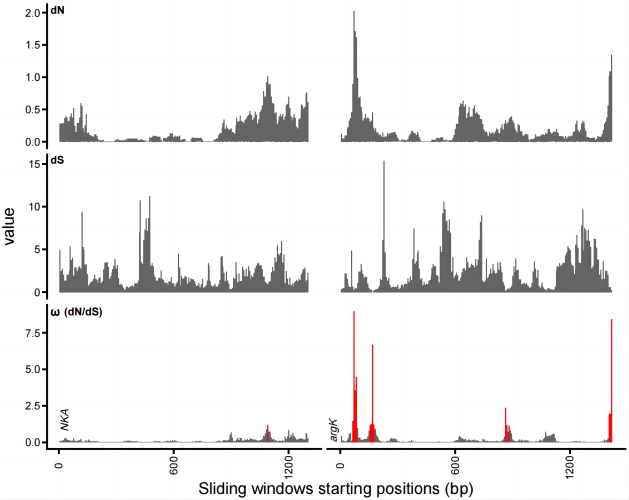
This script is designed for calculating dN/dS/ω values across a sliding window, providing insights into the selection pressure on different regions within a specific gene.
This script appears in blog post.
Execute the script using the following command:
$ python sliding_window.py ogfile fa_dir sli_len gap_len cpu_num code_modelPrerequisite: The script requires KaKs_calculatorv3. Ensure that the path to KaKs is correctly set in your environment variables before running the script.
Parameters:
fa_dir: Path to the directory containing thefastafiles to be compared.sli_len: Length of the sliding window.gap_len: Interval between each sliding window.cpu_num: Number of CPU cores used byKaKs_calculatorv3.code_model: Codon translation model used in the calculations.
Example Usage:
$ python sliding_window.py ogfile fa_dir 57 6 20 1This example sets a sliding window size of 57 bp, with a step size of 6 bp, utilizing 20 CPU cores, and employing the standard codon table.
Output Processing: The output .res file can be visualized using the following R code:
library(ggplot2)
library(ggpubr)
library(ggprism)
library(readxl)

barplot = read.delim("xxx.res")
color = rep("black", times = length(barplot$Type))
color[barplot$value > 1 & barplot$Type == "omega"] = "red"
barplot = cbind(barplot, color)

pdf("slwd.pdf",width = 10,height = 8)
ggplot(barplot,aes(Position, value, fill = color)) +
  geom_bar(stat = "identity",width = 0.9) +
  theme_prism() +
  theme(axis.line.y=element_line(linetype=1,color="black",size=1),
        axis.line.x=element_line(linetype=1,color="black",size=1),
        axis.ticks.x=element_line(color="black",size=1,lineend = 1),
        axis.ticks.y=element_line(color="black",size=1,lineend = 1),
        axis.text.x = element_text(angle = 90, size = 12,face = "plain"),
        axis.text.y = element_text(size = 12,face = "plain"),
        axis.title=element_text(size=18,face="plain"),
        legend.position = "none") +
  xlab("Sliding windows starting positions (bp)") +
  facet_grid(Type ~ Gene, scales="free",space="free_x") +
  scale_x_continuous(breaks = seq(0, 300, by = 100),labels = c("0", "600", "1200", "1800")) +
  scale_fill_manual(values=c("#666666","red"))
dev.off()
This R code produces a bar plot displaying the calculated values, with specific color coding to highlight significant findings. The output visualization can be further refined using AI tools for enhanced clarity and presentation.
Example Plot:
Following alignment and trimming, some Multiple Sequence Alignments (MSAs) may exhibit reduced sequence length, potentially due to excessive trimming or the prevalence of gaps. These shortened MSAs often contain less informative content, making it prudent to filter them out to ensure only qualified MSAs are retained for subsequent analysis.
Note: This script uses @ as the species identifier. If your data utilizes _ as a species identifier, you can employ OTU_replace.py for conversion, or alternatively, modify this script to suit your requirements.
This script appears in blog post.
$ python /pathto/trim_filter.py -t 30Parameters:
-t: Sets the minimum number of taxa required to retain an Orthologous Group (OG). It effectively defines the minimum number of Operational Taxonomic Units (OTUs) needed.-a: Specifies the minimum length for a trimmed alignment in amino acids (or nucleotides), with the default being 80.-s: Removes original sequences shorter than this specified length. The default threshold is 80.
The process and status of trimming can be monitored in the trim_filter.log file.