VTKDataIO.jl presents a number of input, output and visualization functionalities for geometric meshes with point and cell scalar and vector data. This module attempts to bridge between VTKDataTypes.jl, Julia's native module for representing VTK data types and the Visualization Toolkit (VTK) hence giving access to many of VTK's capabilities to Julia users.
VTKDataIO.jl was only tested with Python 3.8. Make sure PyCall is buit to use Python 3.8.
You can use VTKDataIO.jl to read/write any of the following file formats into/from the corresponding type in VTKDataTypes.jl: vtk, vtu, vtp, vts, vtr, vti, vtm, pvd, stl, ply. You can do this using read_vtk, write_vtk, read_stl, write_stl, read_ply, and write_ply.
You can use VTKDataIO.jl to visualize a scalar or vector field with a 3D heat map and a legend. This includes point-based coloring or cell based coloring, as well as other features such as wireframe and glyph representations. The resulting visualization can be written to ply or x3d formats. You can do this using visualize, write_x3d, and write_ply. visualize_3ds can also be used to visualize 3ds files directly.
You can use PyVTK to change a Julia native VTK object to a VTK data PyObject that can be used in your own VTK pipeline through PyCall. You can also use _VTKDataTypes to change a VTK data PyObject back to Julia's native VTK types.
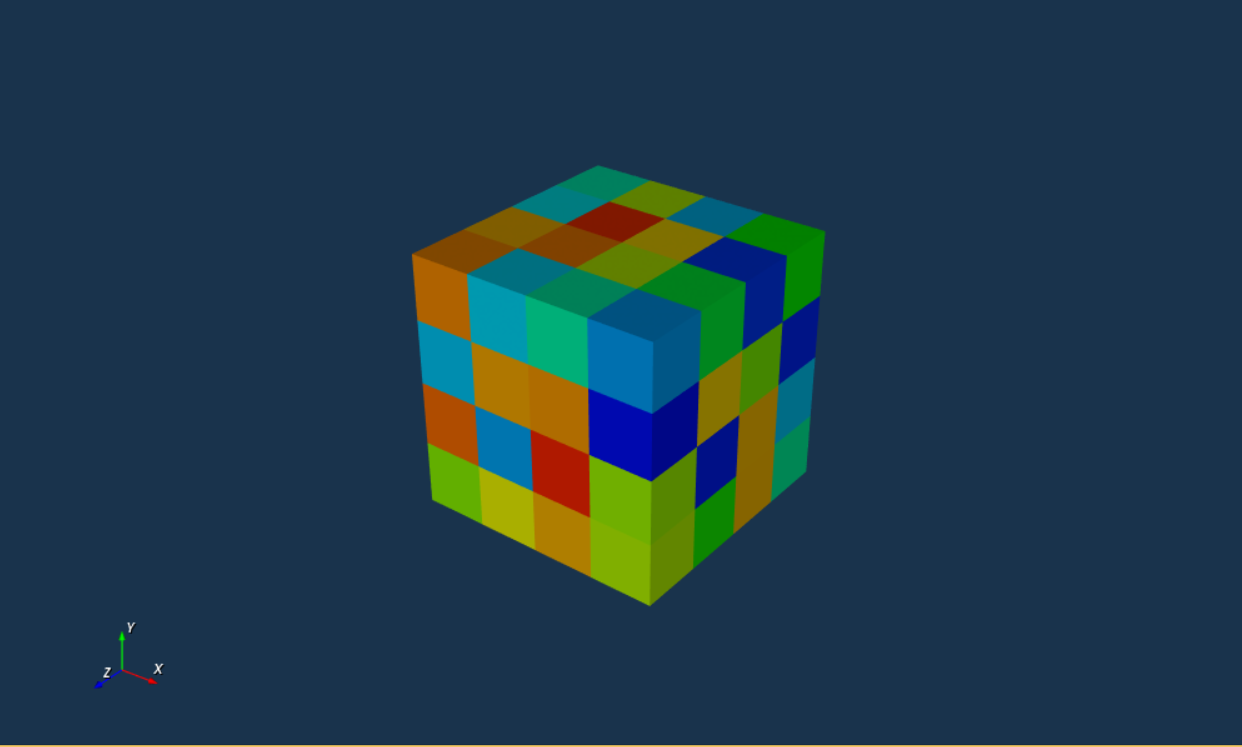
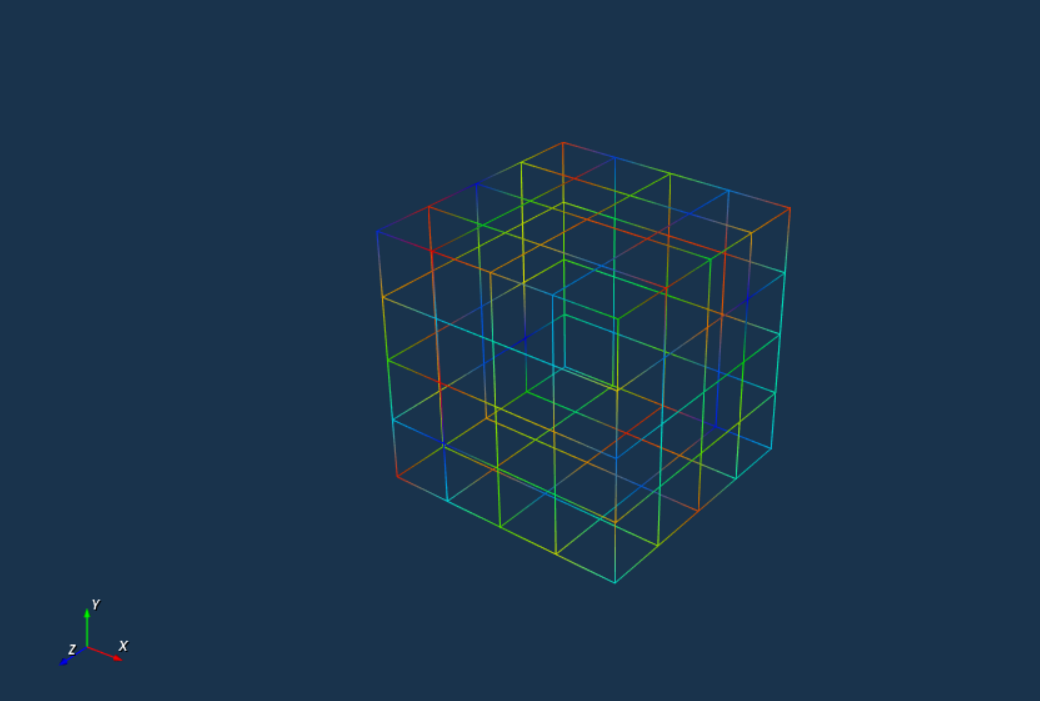
If you run the following code, you should be able to get a cubic mesh with randomly coloured cells.
using VTKDataTypes
using VTKDataIO

x = y = z = [-2, -1, 0, 1, 2];
rect = VTKRectilinearData((x, y, z));
rect.cell_data["Cell scalar"] = reshape([rand() for i in 1:num_of_cells(rect)], cell_extents(rect));
visualize(rect, color="Cell scalar")
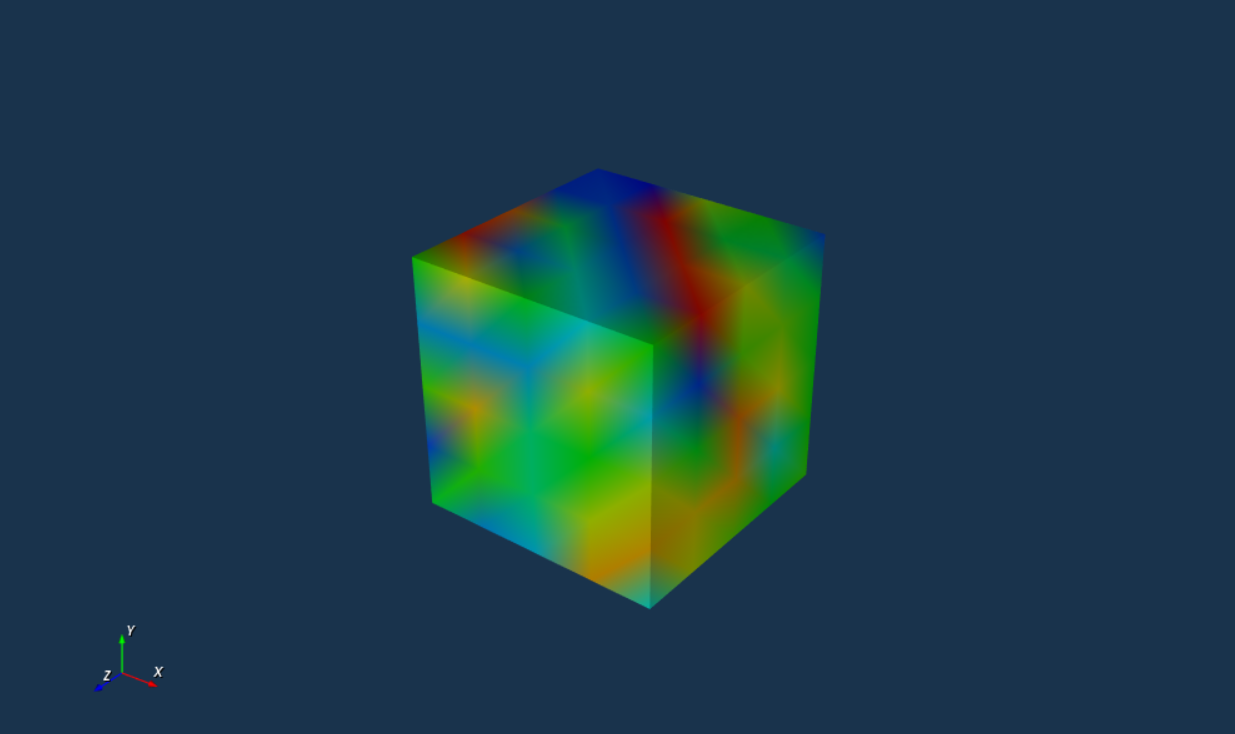
You can also do point-based coloring as so:
rect.point_data["Point scalar"] = reshape([rand() for i in 1:num_of_points(rect)], extents(rect));
visualize(rect, color="Point scalar")
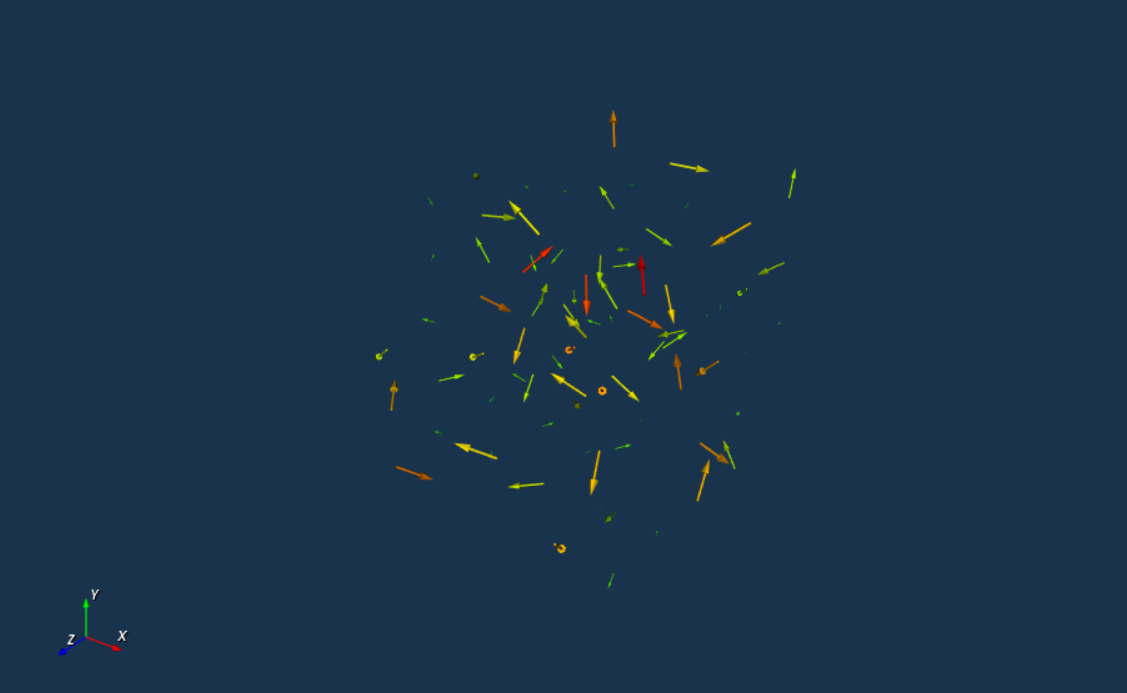
Point based vector data can be represented by arrows using the representation option.
rect.point_data["Point vector"] = reshape([2*rand()-1 for i in 1:3*num_of_points(rect)], (3, extents(rect)...));
visualize(rect, color="Point vector", representation=:glyph, scale_factor=0.5)
Wireframe representation can be used as follows:
visualize(rect, color="Point scalar", representation=:wireframe)
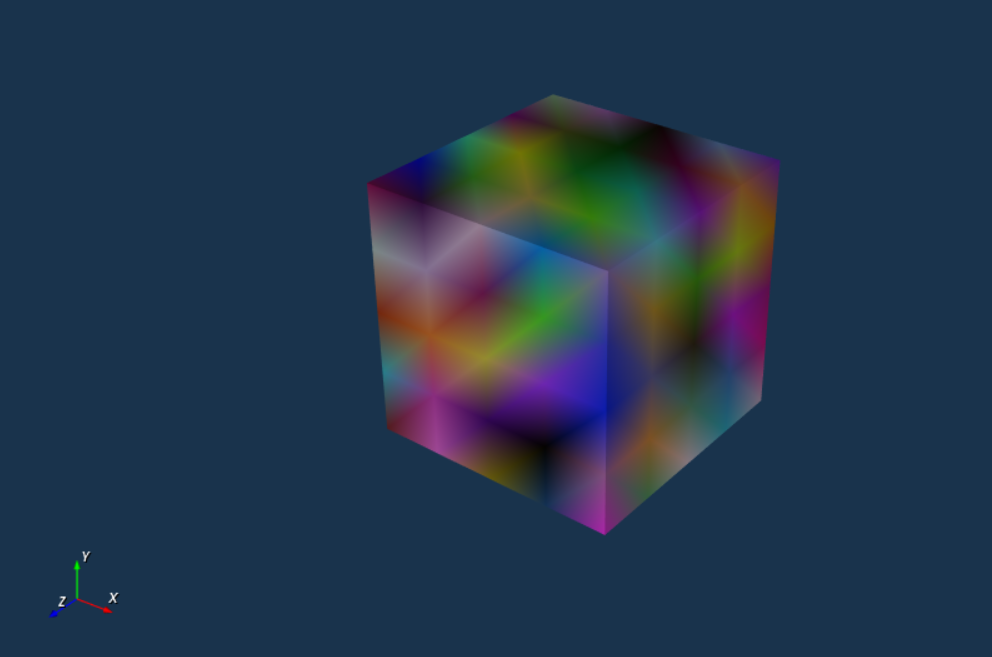
If you have the RGB colors data directly, you can inform the visualize function to use it using the RGB = true option as so:
rect.point_data["RGB colors"] = reshape([round(255*rand()) for i in 1:3*num_of_points(rect)], (3, extents(rect)...));
visualize(rect, color="RGB colors", RGB=true)