Skip to content

Plots log histograms of FCS files like CyTOF's PlotViewer program

Notifications You must be signed in to change notification settings

JimboMahoney/CyTOF-PlotViewer

Folders and files

NameName
Last commit message
Last commit date

Latest commit


History

18 Commits


Repository files navigation

CyTOF-PlotViewer

Plots log histograms for user-selected parameters of FCS files like Fluidigm's PlotViewer program. Works for both CyTOF and Flow.

UPDATE 3rd Mar 2020 - Improved memory usage and processing time by downsampling data.

e.g. like this:

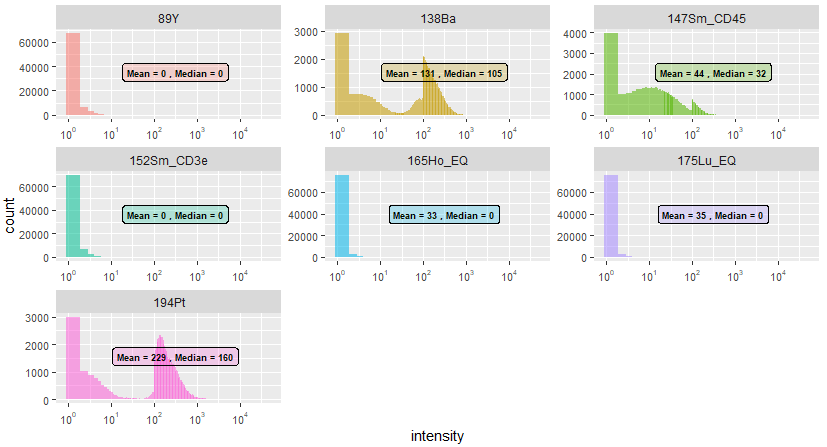
I realised that the PlotViewer program, supplied with Fluidigm's CyTOF software, although limited, is quite nice in the way it shows histograms of the data.

I set about trying to recreate this so that I could quickly view every (or a selection of) parameter(s) in FCS files.

I'm quite happy with how it turned out.

See also:

https://github.com/JimboMahoney/CytobankGraphs

https://github.com/JimboMahoney/CytoBars

About

Plots log histograms of FCS files like CyTOF's PlotViewer program

Topics

Resources

Stars

Watchers

Forks

Releases

No releases published

Packages

No packages published

Languages