Home
Welcome to the sequencingData_track_R wiki!
The R code was developed to draw the visualization of signals, which were produced from the next-generation sequencing data, such as Chip-seq, RNA-seq, BS-seq, and so on. In particular, the preprocessed data is a normalized signals via the function 'genomeCov' of bedtools. After that, the R code may be called to draw signal tracking for a batch of samples. For more details, please check README.
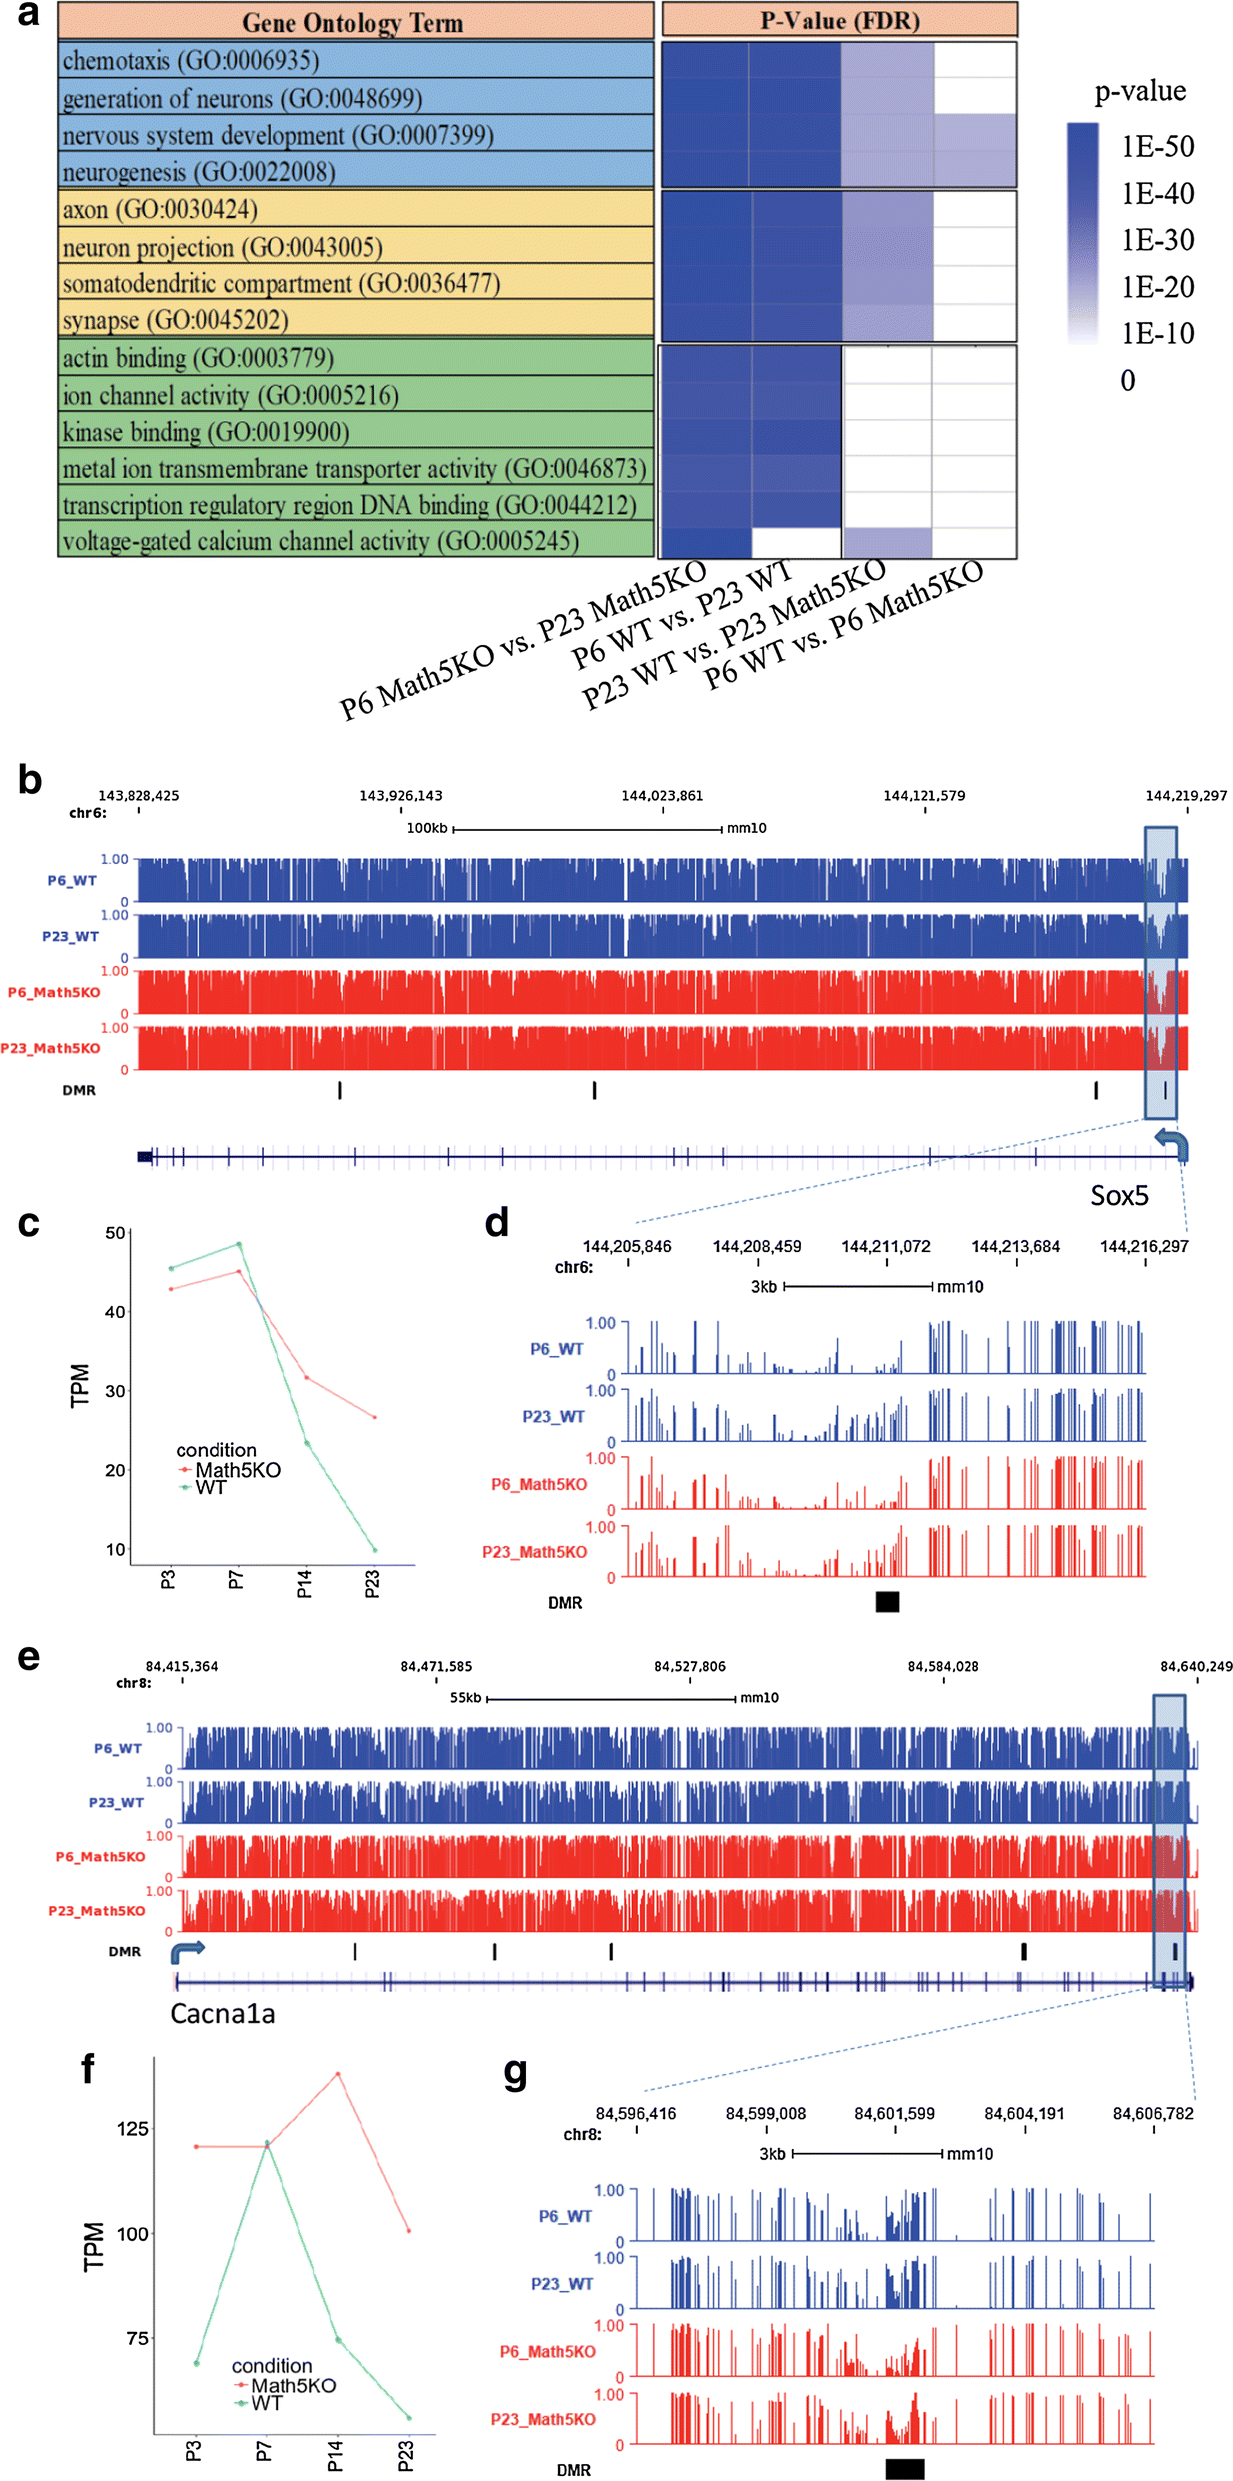
Reference: Jianlin He, Xiguang Xu, Aboozar Monavarfeshani, Sharmi Banerjee, Michael A. Fox, Hehuang Xie. Retinal-input-induced epigenetic dynamics in the developing mouse dorsal lateral geniculate nucleus.Epigenetics & Chromatin (2019) 12: 13.