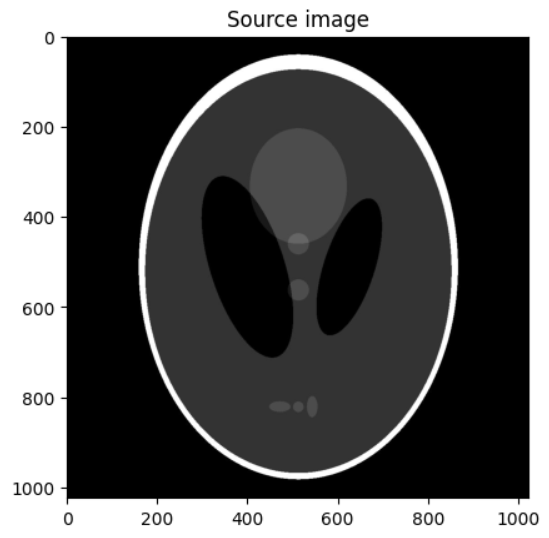
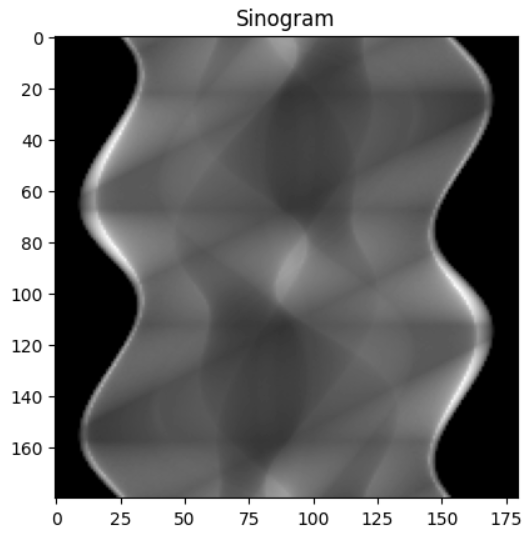
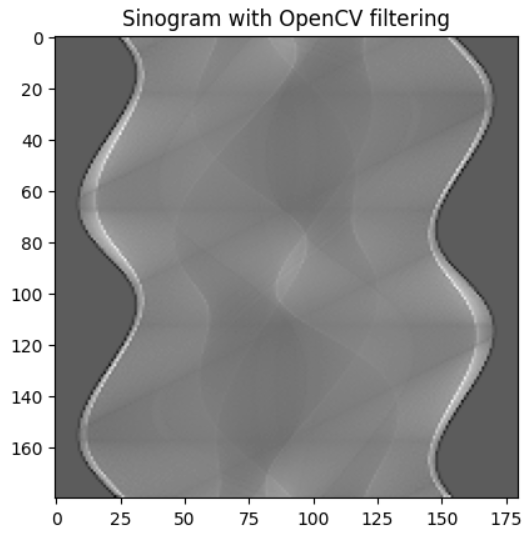
Hi! We created a project which explains how to convert image into a sinogram and vice versa with filtering, normalization and visualization. You can see the progress by moving the progress bar and saving to a DICOM file! Here is a main code, enjoy!
- numpy - filtering with convolve arrays and math
- scikit-image - draw lines using ski.draw.line_nd(E, D), image
- matplotlib - plots
- pydicom - extension of a file
- cv2 - filtering with cv2.filter2D
- ipywidgets - interact (slider)
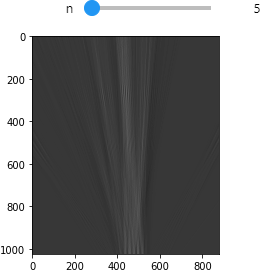
One of the most interesting part of an experiment. Move progress bar to check how is Radon transform actually works! I wish I don't spoiler too much...
All the result of an experiment is summarized here by MSE measure at the bottom of the page.


- Marcin Szwarc
- Helena Masłowska