Home
This package provides resources for incidence computation and visualisation based on outbreak line-lists. These resources include:
- get.incidence2: extensions of the OutbreakTools::get.incidence function to allow for doBy statements and conversion to xts/zoo objects
- linelist2xts: takes a linelist in a dataframe and aggregates in flexible fashion using LHSVar ~ RHSVar, with the dates being 'massaged' by a date projection function (e.g. to boil down to monday of the ISO week, start of the month, etc)
- plotIncidence: plot incidence as histograms
- mapIncidence: animate incidence in space and time using maps and time series
- data: Hagelloch 1861 measles outbreak (as obkData object)
To install it:
library(devtools)
install_github("Hackout2/incidence")
Examples of the main functions:
## try plotIncidence
library("incidence")
example("plotIncidence")
## try mapIncidence
head(zombie_outbreak)
mapIncidence(head(zombie_outbreak,20000), 3,
"x.coord","y.coord", fill.by="gender",
jitter=0, zoom=15)
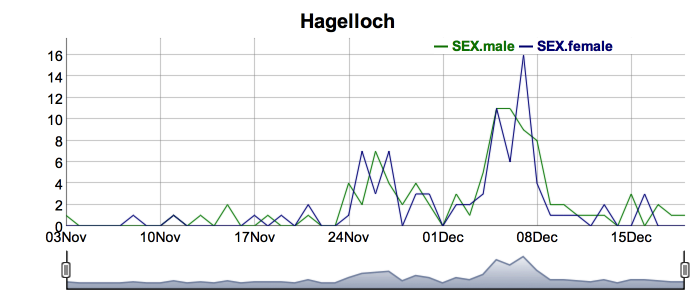
#Get the epi curve for the Hagelloch data and visualize using
#the dygraphs package
library("xts")
data("hagelloch.obk")
sts.xts <- inc2xts(get.incidence2(hagelloch.obk, "timeERU", doBy=c("SEX"), add.zero=FALSE))
library("dygraphs")
dg <- dygraph(sts.xts, main = "Hagelloch") %>%
dyRangeSelector(dateWindow = range(index(sts.xts)))
dg
#Demo of the linelist2xts function
demo("incidence", package="incidence",ask=TRUE)
#Show conversion from linelist to time series animate using
#the surveillance package.
demo("hagelloch", package="incidence")
Sometimes, a collection of pictures motivates more than 1,000 lines of code
Dynamic time series using the dygraphs package: