
Support for logging [tracing][tracing] events natively to linux kernel debug tracing.
tracing is a framework for instrumenting Rust programs to collect
scoped, structured, and async-aware diagnostics. tracing-atrace provides a
[tracing-atrace::Layer][layer] implementation for logging tracing spans
and events to [linux kernel debug tracing][kernel debug], on Linux
distributions that use debugfs.
Compiler support: requires rustc 1.40+
Tracing is built against the latest stable release. The minimum supported version is 1.40. The current Tracing version is not guaranteed to build on Rust versions earlier than the minimum supported version.
Tracing follows the same compiler support policies as the rest of the Tokio project. The current stable Rust compiler and the three most recent minor versions before it will always be supported. For example, if the current stable compiler version is 1.45, the minimum supported version will not be increased past 1.42, three minor versions prior. Increasing the minimum supported compiler version is not considered a semver breaking change as long as doing so complies with this policy.
$cargo build
$sudo umount debugfs

$sudo mount -t debugfs none /sys/kernel/debug/

$sudo mount -t debugfs -o rw,mode=777,remount /sys/kernel/debug/

$sudo chmod -R 777 /sys/kernel/debug
// one chat server
$cargo run --example chat
or
$cd target/debug/examples && ./chat

// as chat client and enter key.
$telnet localhost 6142
// normal capture
$./atrace -T 10 > trace.log

// capture compress atrace log
$./atrace -T 30 -Z > atrace.log.z

// uncompress atrace log
$./atrace -d atrace.log.z > atrace.log
open chrome browser,and enter chrome://tracing in url address.
in its load button, select your trace.log, you'll get your tracing result.
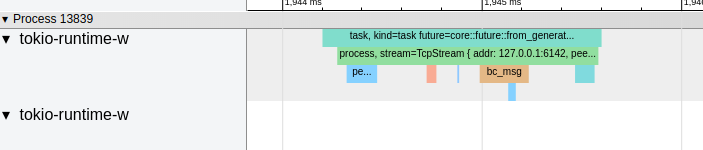
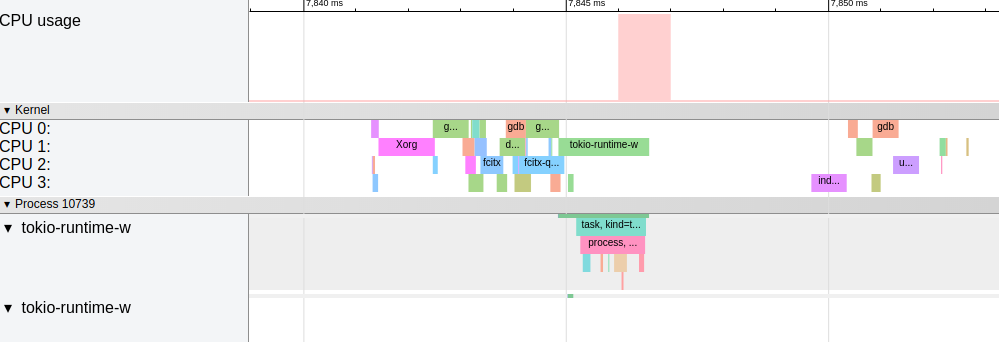
chat tracing result example:
$./atrace --help

// capture cpu schedule infos.
// it'll have big size log file with cpu scheduleinfos.
$./atrace -T 30 -Z --CPU_SCHED > atrace.log.z

This project is licensed under the MIT license.
Unless you explicitly state otherwise, any contribution intentionally submitted for inclusion in Tracing by you, shall be licensed as MIT, without any additional terms or conditions.