
Photo: Andrew Kelly - Reuters
This project focus on the Black Lives Matter Movement trough a statistical analysis to compare and contrast the treatment of African Americans and other ethnicities in the American society.
Black Lives Matter (BLM) is a movement that started as a hashtag for Twitter, and it has evolved to a political and social movement, aiming to visualize and intervene in violence inflicted on Black communities, under the BLM movements many protests have been promoted around the globe advocating against police violence towards black people. The main focus of the movement is to end with police brutality.
To understand the facts behind the claim of BLM, we are going to examine data from US authorities and how they treat people to assess if there is a difference in the way they treat Black Americans. The supporting data used towards this project comes from the US Census Bureau, New York Police Department, open data sources from some main metro US areas (Chicago, Dallas & LA), demographics including education, housing, and politics, and lastly data from the police authority. By using different statistical analysis techniques we aim to answer some questions such as how the police treatment towards black people has changed over the years, are African Americans being arrested more often than white, whats the group age seeing more disparity in police treatment among others.
-
Adriana Ortiz (@adriortizb)
-
Enzo Novi Migliano (@EnzoNMigliano)
-
Juan Zambrano (@jjzp12)
Why?
There is plenty of evidence of the mistreatment some minorities receive in the American society. So much so that here are some facts about such reality:
-
Jurors are more likely to give the death penalty in cases in which Afrincan American Defendents are accused of killing [1].
-
Unarmed African Americans are 3.5 more likely to be shot by police than unarmed Caucasian [2].
-
Up to March of 2017, 47% of all exonerations of wrongfully convicted people were African Americans while making up only 13% of the United States Population [3].
-
African Americans are 6 times more likely than Caucasians to victim of a homicide (African Americans 19.6 homicides per 100,000, Caucasians 3.3 homicides per 100,000) [4].
Where?
Our team strived to collect data from different locations to compare and contrast what is happening in different sprectruns such as:
-
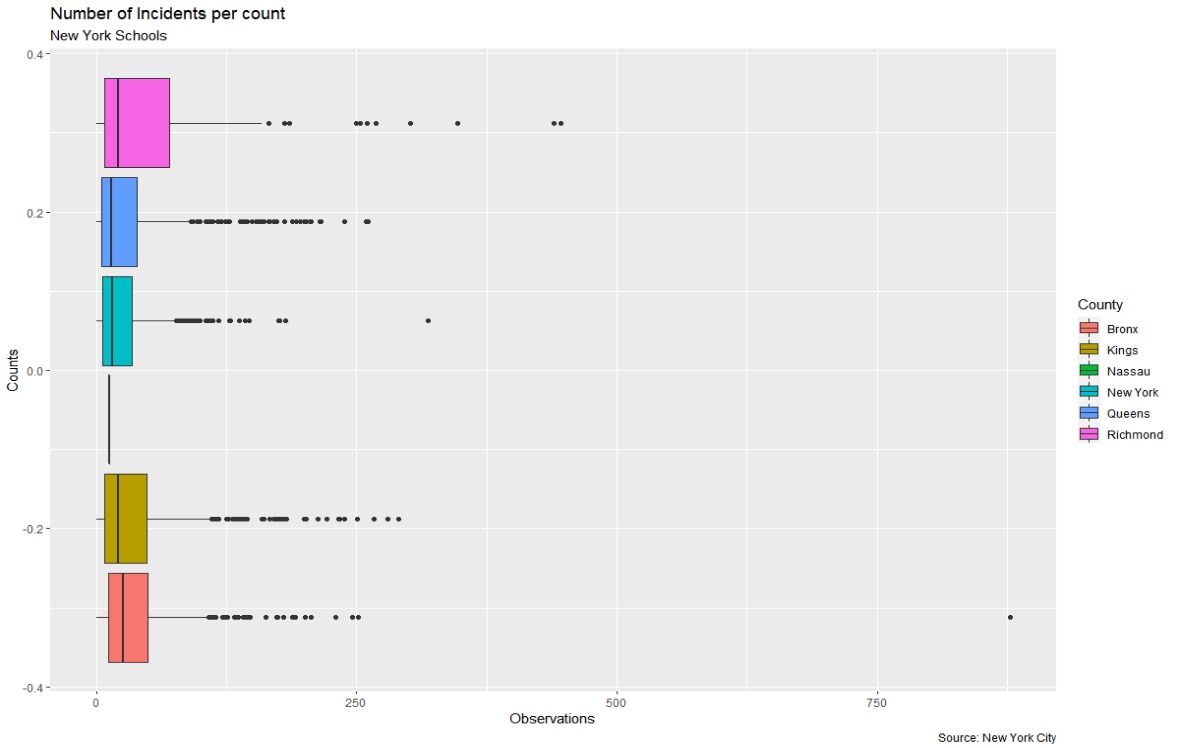
City (e.g., New York City and the stop and frisk police implications)
-
Count (e.g., Comparing and contrasting nearby counts)
-
State (e.g., State comparison of police brutality indicators)
-
United States (e.g., National overview of the social injustice problem)
When?
2020 was a espressive year for the Black Lives Matter movement with protests for racial justice happening all around the globe.The data of the social injustice, however, is not only expressive in the present time. In fact, the data on social injustice has been expressive for many years. Therefore, our team collected data from different periods of time to better understand the development of the social injustice up to today's society.
How?
Our team collected more than 2gb worth of data from different reliable sources such as:
-
Governmental data (e.g., data.gov).
-
News papers (e.g., Whashington Post).
-
Reliable private institutions (e.g., Kaggle).
The data was utilized for our different staticals analisys ranging from descriptive to predictive analytics, as well as good visualizations of the problems.
NOTE: All the data sets and the R code utilized are available in the project repository.
we performed several statistical tests, including the following:
-
Hyphotesis testing:
-
Unpaired T-test
-
Probability Test
-
-
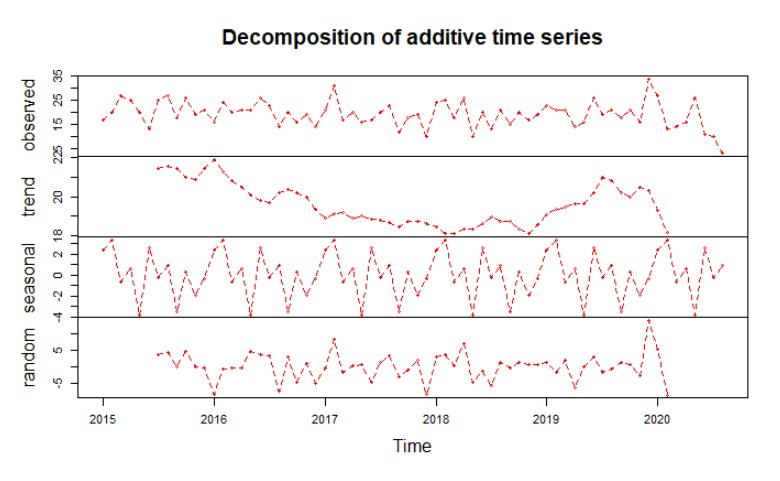
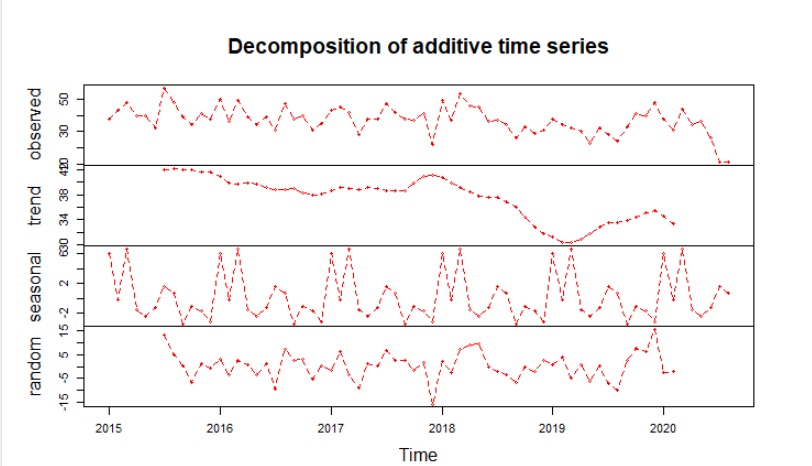
Time Series Analysis
-
Non-Linear Regression
-
T-Test / Wilcoxx
-
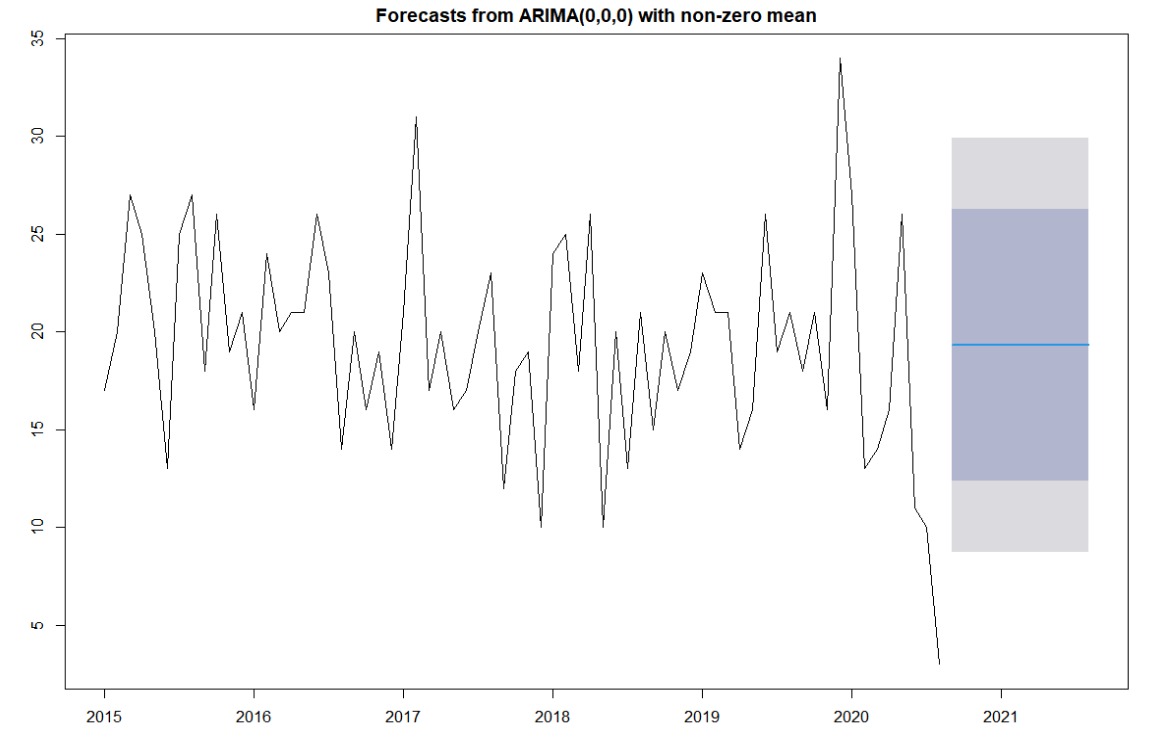
Forecast
-
Loess Method
The Black Lives Matter movement is a complexed issue in our society as a whole. Although, our results did not show significant difference in our Hypothesis, the problem in disparity between races is much complex than the analysis available in this study.
In future studies, in order to achieve meaningful results, more complex analysis must be done.
The Top 3 States With More Police Kills 2015-2020(OCT)
| State | Number of Deaths by the Police | Mean Age | SD Age |
|---|---|---|---|
| California | 690 | 34.6 | 11.5 |
| Texas | 428 | 35.7 | 12.8 |
| Florida | 329 | 38.2 | 13.8 |
Source: The Washington Post
The entire coding for the project can be found inside the folder named code. In other to use such code you must have R and Rstudio install in your computer or any R service provider in the cloud. We recommend that you open the R project named BLM not the R Markodown file named BLM-1_0_0. After openning the working directory, we recommend to then open the R Markdown file, and thereafter, before running any code, open the RData file named BLM-3_0_0 in this following link (https://drive.google.com/file/d/1RPj9rReeIvcL0RD3N4Te4SJPbodgDbr3/view?usp=sharing) that will save some time loading the data sets that are quite large files. Once you are done loading the RData our team recommends to run the hash tags Installing.libraries and Loading libraries (note that if do not have a library install in your local computer you will have to take off the #hash tag before the command "intalling.library"). Finally, once you have your libraries installed our team recommend to run all the chuncks below starting from the hash tag results. However, if the RData file does run properly, you can always run the code by clicking in icon run and then run all.
[1] J. S. Hunt, “Race, ethnicity, and culture in jury decision making,” Annu. Rev. of Law and Social Sci., vol. 11, pp. 269-288, Nov. 2015, doi: 10.1146/annurev-lawsocsci-120814-121723.
[2] C. T. Ross, “A multi-level bayesian analysis of racial bias in police shootings ar the county-level in the United States, 2011-2014,” PLos ONE, vol. 10, no. 11, pp. E0141854, Nov. 2015, doi: 10.1371/journal.pone.0141854.
[3] National Registry of Exonerations, “Race and wrongful convictions in the United States,” 2017. [Online]. Available: https://www.law.umich.edu/special/exoneration/Documents/Race_and_Wrongful_Convictions.pdf
[4] US Department of Justice, “Homicide trends in the United States, 1980-2008,” 2011. [Online}. Available: https://www.bjs.gov/content/pub/pdf/htus8008.pdf
[5] Crime and Enforcement Activity in New York City, 2019. [Online] Available:https://www1.nyc.gov/assets/nypd/downloads/pdf/analysis_and_planning/year-end-2019-enforcement-report.pdf