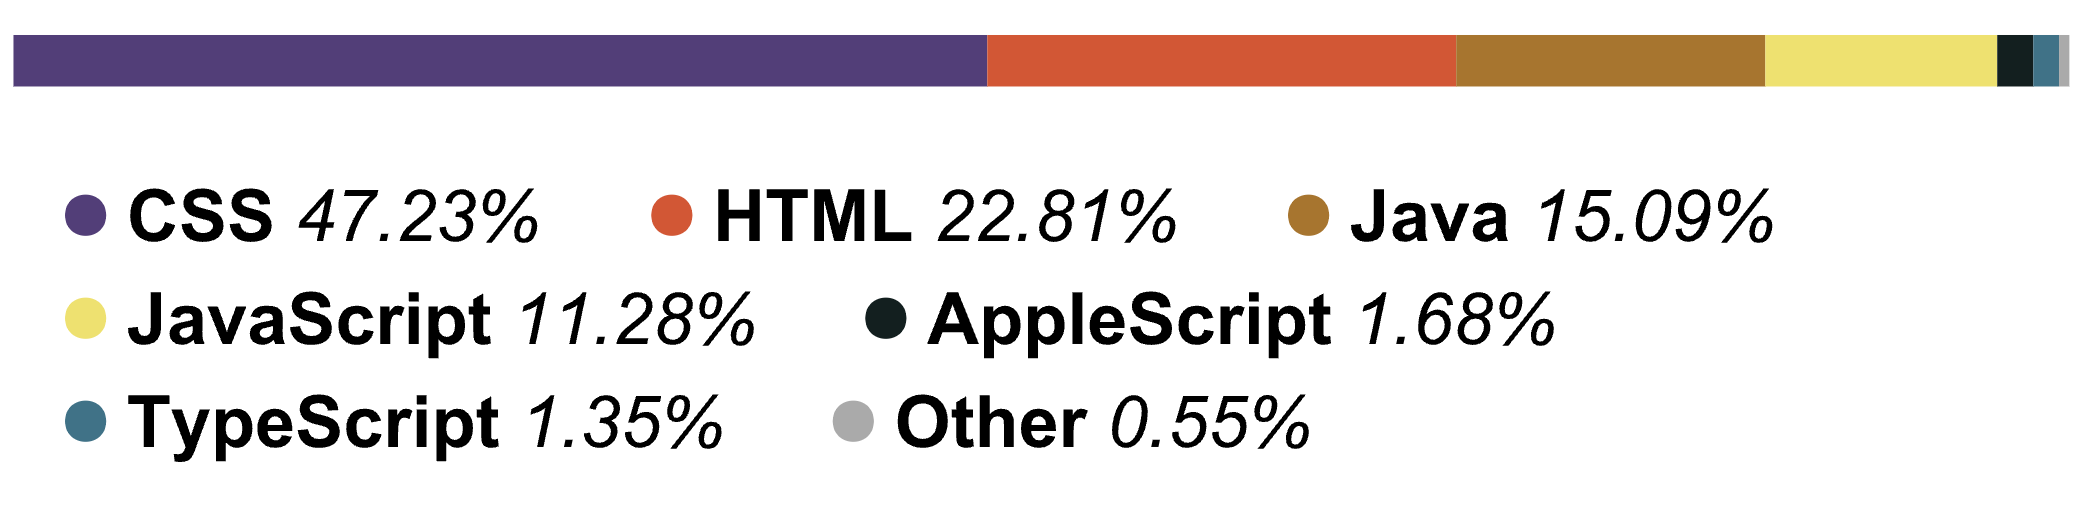
With langstats, you can create a high-quality image (both as an SVG or PNG) of the programming languages and their percentages used in your directory. It is runnable anywhere and is highly customizable, an improved clone of the linguist package that comes with GitHub itself. And best of all, it takes just two lines to install and run!
This is an executable Python script that can be run from any folder or location on your device. This means that you can easily view the language distribution for folders that don't have the python script in their directories. By implementing this, a major advantage is introduced over linguist, which can only be used for visualizations for GitHub repositories, often takes hours to refresh, and has very weak text-only command-line functionality.
It's very easy to change the look of your outputted image. You can easily specify at what percentage programming languages will merge into the 'Other' category, as well as how many unique languages to display at once. Likewise, you can limit the depth that the program searches for files based on distance from the root directory. You can even choose which file extensions to ignore!
The program can recognize filenames that do not have an extension, such as a Dockerfile or a Cakefile without an issue.
This program is bundled as a Python package. This makes it very easy to install, cross-platform, and available globally. All you need to do is run the command statistics from anywhere in order to get your outputted image. To be able to do so, you need to simply install the package from the PyPI directory:
$ python3 -m pip install langstatsDo note that you may have to refresh your terminal for the command to be recognized. If you'd like to uninstall the package, simply run:
$ $ python3 -m pip uninstall langstatsIf you'd like to make a local copy, you can clone this repository and run the following command from the root directory:
python3 -m pip install -e .Ubuntu and pycairo don't play well together. You have to manually install pycairo's dependencies first by running the following commands. These will clone pycairo, install its dependencies, and then add it as a Python package locally. Make sure to change the cd /home/username/ etc. to wherever you want to clone it.
>>> cd /home/username/Programming/Repositories/
>>> sudo git clone git://git.cairographics.org/git/pycairo
>>> sudo apt-get install libcairo2-dev libjpeg-dev  libgif-dev
>>> cd pycairo
>>> sudo python3 setup.py install
After you have done so, you should install the package locally as normal.
By running statistics, the program will search through all files in the root directory and lower, and then create a file named output.svg in the root directory! You can view this by right-clicking and then selecting: View in: <Your browser here>. You can also explore the various ways to generate it with argparse.
Likewise, you can also choose to output the image as a png, exlcude certain files, or tweak other flags by looking below.
The following flags are available, and they are all optional (if you ignore them, nothing will happen):
- -d or --depth: how many directories 'deep' the program should search for files in, default 3. A depth of one means reading files only in the root directory, a depth of 2 means files only in root directory + subdirectories, etc. Example:
statistics -d 5will search to a 'depth' of 5 from the root directory.
I highly recommend trying this command out on your Desktop with a depth of 5 or 6, the results are incredible! - -t or --type: the type of file outputted - svg or png. Defaults to svg as that is much higher quality. Specify 'png' to choose png. Example:
statistics -t png - -l or --limit: the limit on the percentage size of the 'Other' category. Default is 1. Example:
statistics -l 5(as many languages as possible will be added to 'Other' while ensuring it has a maximum size of 5%) - -m or --maximum: the maximum number of unique languages to show (excluding 'Other'). Default is 8. Example:
statistics -m 3will show at most 3 other languages in addition to 'Other' - -e or --exclude: which file extensions to exclude when searching for files and creating the image. These files will be ignored and will not affect the total percentage or show up. You can specify multiple. Example:
statistics -e .ipynb .css .html - -n or --names: which filenames to exclude (for files that do not have an extension, such as a
Dockerfile). You can specify multiple. Example:statistics -n Dockerfile Cakefile Emakefile - -c or --colors: which hex colors to be used for creating the image. Applied left to right from highest percentage
to lowest. If no colors are provided, or too few, the YAML will be used or another strategy to pick the remainder of
the colors. Example:
statistics -c ffb6c1 00ff00 - -s or --skip-dirs: list of relative directory paths to exclude when generating the visualization. Example:
statistics -s node_modules .idea
The above flags can be used in any order, combined, and are completely optional (statistics --type png -l 5 -m 3 --depth 4 -e .ipynb). If you are ever in doubt you can run statistics -h to get a help output on console reminding you of the flags.
I based this idea off of linguist, which is the default GitHub program used to generate the color bar used in every repository. I also used their permissively-licensed languages.yml file to
recognize programming languages.