A Machine Learning Project and Data Analysis Project of Seattle Traffic and Collisions Data to Better Understand Why Collisions Happen
This public repository contains the Machine Learning Team's materials for the Traffic Collisions Project, organized by the Projects Circle.
- Cindy Wong
- Isaac Campbell-Smith
- Maureen Petterson
- Feli Gentle
| Introduction | Exploratory Data Analysis | Probabilistic Estimating | Machine Learning I | Machine Learning II | | Conclusions & Policy Recommendations |
Seattle is a bustling metropolis with thriving public transportation and a purpotedly bike-friendly commuting infrastructure. Though the city's rate of traffic collisions is about 30 per day, it's been trending downward. There were 11,186 collisions last year vs over 30,000 collisions between 2005 & 2006. Seattle has seen a steady decline in annual collisions since 2015 though the argument could be made that numbers would have trended downward much earlier if not for the rise of mobile phones and distracted driving.
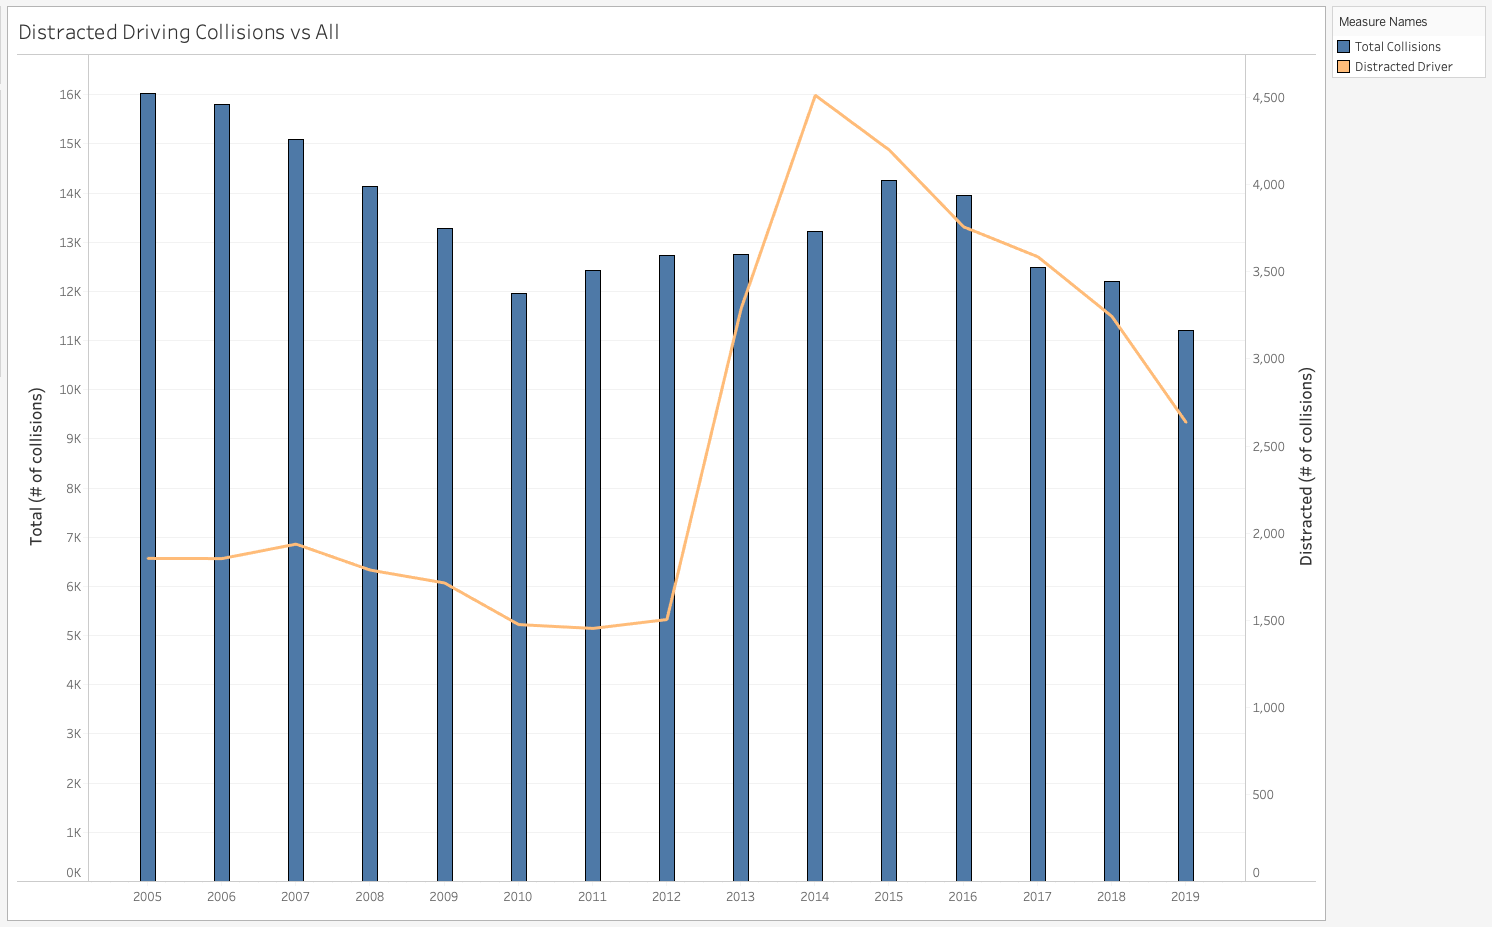
The dramatic increase in reported collisions with distracted drivers from 2013-15 points to a common theme in the data quality available to us - how much are the features being influenced by external forces or simple human error? Our research was inconclusive but it's possible that the sudden rise in collisions related to distracted driving has more to do with police aggresively investigating cases or casting a wider net to include such cases.
For more a more in-depth overview of the technical and statistical components of the datasets, checkout this notebook: https://github.com/DataCircles/traffic_collisions_ml_team1/blob/master/notebooks/data_report.ipynb
That drugs/alcohol-caused collisions have kept remarkably steady since 2005 is somewhat telling - about 500 per year. It's completely possible that current actions in place to combat driving under-the-infulence are keeping them at this rate, it seems clear that a different (likely harsher) approach is needed to get those numbers down.

Additionally, we noted that the rate of injuries in collisions involving pedestrians and cyclists was quite high: 90% of those collisions resulted in an injury, compared to just 27% injury rate in collisions not including pedestrians of cyclists.
Looking at a bar chart of the features present in both pedestrian/cyclist collisions vs collisions without pedestrians/cyclists already builds an intution for what features the model will likely deem important.

Since the main collisions data only contains locations that had a collision, we decided to look for what is NOT there. We sought out other data that might be able to help us fill in the gap. Using a complete list of blocks, crosswalks and circles along with more detailed features, we can merge it with the collisions data to have locations with and without collisions together. Note that these did not account for traffic flow.
Over the years, about 72.5% of the blocks recorded has had at least one collision. Around 15% of those collisions involved pedestrians or cyclists. Looking the blocks data, there are 3 columns that seem like it could have significance: speed limit, slope percentage and artdescript (label of type of arterial road). We found that most blocks are categorized as some type of neighborhood street and thus a large number of them have pretty low speed limits- about 87% is less than 30mph.

A deeper look into the slope percentage and we discovered that the average slope of the top 10 blocks with the highest amount of collisions is about 1.4% while the bottom 10 blocks are higher at 3.8%.

While the dataset mostly contains blocks that are not an arterial road, the blocks with the highest collisions are basically all classified as arterial types. If we take a look at the types of arterial description of collisions vs non-collisions, we can see that most major roads fell in the category of collisions:

Compared to blocks, only about 36% of crosswalks had an incident. About 95% collisions that happened at crosswalks involved a pedestrian and/or cyclist. Of those collisions, 2% resulted in a fatality.

We took a look at the district locations of these crosswalks. District 7 seems to have the most crosswalks (~26%) with District 2 being the second most (~18%).

Another column to observe is the crosswalk control.

There isn't a clear difference except for the stop sign type. More crosswalks with stop signs fall into the no collisions category.
About 77% of recorded traffic circles has had at least 1 collision over the years, more than blocks and crosswalks. Looking at the district locations, they are quite different than the crosswalks with District 5 and 3 being ones with the most traffic circles and district 7 being the less.

Yearly Trends
 |
 |
 |
Each road has a different arterial classification, which generally indicates if it's a major traffic throughway, or less so.
ARTCLASS - Arterial classification code:
5 - Interstate Freeway
4 - State Highway
3 - Collector Arterial
2 - Minor Arterial
1 - Principal Arterial
0 - Not Designated (not an arterial)
Our studies have found that the vast majority of accidents happen on Arterial Class 1. When grouping for arterial classes we see:

Arterial class 1 has by far the most collisions per sheer count. It makes sense given the high traffic flow of these roads. But could there be other factors that contribute to this seasonal spike early in the year, during cold months? One would reasonably expect bad weather and road conditions to be at play. Let's find out:

So road conditions don't seem to be capturing the full volume of rise in collisions. Is it the weather conditions, generally?


Contrary to my expectations, cold weather and adverse road conditions do not account for the seasonality.
Let's zoom in on the years where we see the seasonality, 2013 to the present (2020).

Capturing the seasonality with a generative model, using TensorFlow Probability's Gaussian Process Model:

This seasonality is not being explained by road conditions or weather. It could have to do with increased traffic flow during these times (more people on the road => more collisions). However, the traffic flow data coverage has only improved in recent years.
There may be other features that indicate the seasonality, and this would be a great research area for further studies.
Though there is a large degree of randomness underlying our data in this inherently random human phenomenon, we suspected that the general trends in collisions suggest one or more switchpoints in the rate of collisions. We turned to the PyMC3 library to infer collision rates, and whether they're increasing or decreasing over time.
Visualize the collisions on Rainier Ave S:

Posterior for lambda_0:

Posterior for lambda_1:

Posterior for lambda_2:

Posterior for tau_0:

Posterior for tau_1:

Visualized with tau points:

Our first approach to learning from these datasets was to look at as many features as possible on each collision to see what were the strongest indicators of whether it would lead to injuries. While this approach does bring some serious data leakage into the mix, we still felt it might still provide insights.
LightGBM was the model we opted for here because it can handle categorical features under the hood without needing to one-hot-encode any columns. We also wanted to see if pedestrian/cyclist-involved accidents would produce different results. Even after tuning hyperparameters, the AUC was only 0.64 and the feature importances amount to a common sense intuition of why injuries might occur in traffic collisions. Whether drugs or alcohol are present, lack of attention, and night-time lighting are important features for this model's predictive power.
Most notable is the difference of important features in the collisions involving pedestrians and cyclists. The influence of alcohol becomes far less important than presence of a crosswalk key and inattention.
 |
 |
 |
 |
Our next approach is to get feature importance from the individual datasets where it simply contains information about the locations themselves and hopefully avoiding the data leakage issue we mentioned. We used Random Forest Classifier (collision or no collision) to obtain feature importances. The AUC score for the crosswalks and circles prediction was only 0.53 and 0.51 respectively but we mainly want to see the top features.
 |
 |
 |
Slope percentage, arterial type and speed limit are all reasonable features to consider when it comes to accidents. Major roads have more traffic flow and thus would tend to have higher risk.
Note that only about 8% of crosswalks at school zones had incidents while about 40% of crosswalks outside of school zones had incidents. Also note there are a lot more crosswalks outside of school zones (~70%).
For circles, the original feature importance was actually traffic circle size. Unfortunately, an overwhelming amount of them were marked 0 and it was deemed unreliable. This goes back to better data collection would help out a lot more with these analysis. Also, looking on google maps, the traffic circles labeled as circles vs ovals basically look the same. Some are slightly elongated in both categories.
Our second approach was to aggregate annual collision counts on the Seattle Streets and Intersections datasest and apply machine learning to predict annual number of accidents on meta features: transit class, slope percentage, speed limit, arterial class and average daily traffic counts for streets; signal type, arterial class and traffic circle (yes/no) for intersections. We used CatBoost for these models because it's Gradient Boosted Random Forest Algorithm is similar to LightGBM but it can handle strings categorically (LightGBM can only interpret integers). It's important to note that the Streets dataset contains multiple iterations of many streets (i.e. 1st Ave N between Broadway and Cherry, 1st Ave N between Pine and Yesler). We did not determine the time it would talk to meticulously map each collision to a particular street segment was a constructive use of time considering all other ML problems in the data, so the median values of the aforementioned features were taken for each named street. The intersections data does not have the same problem, but there are fewer features to study. Ultimately this effort was meant to inform further data analysis and supplement findings therein as the algorithm itself lends little to shape policy.
For collisions not occuring at intersections, speed limit, traffic flow and slope percentage about equally weighted the models predictions.
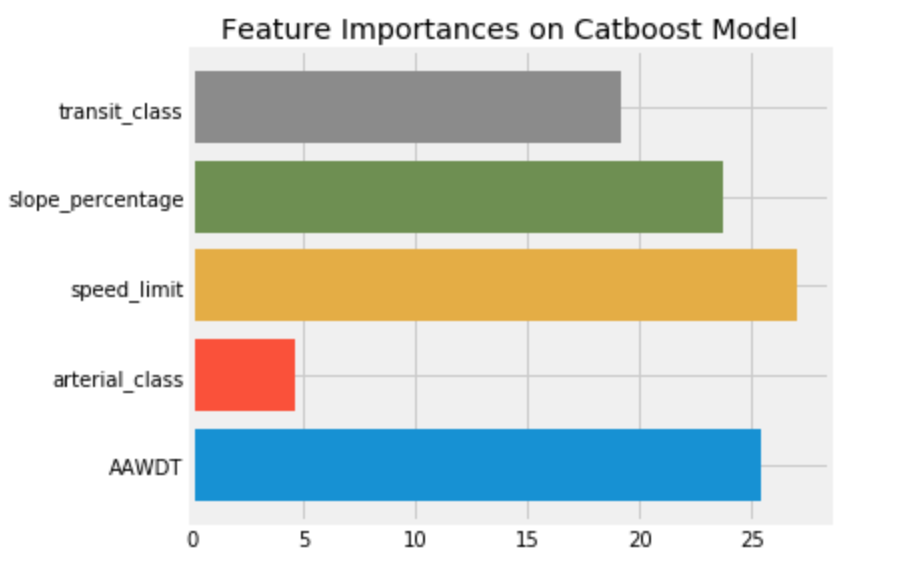
Our interpretation of this modelling is that, at least on a 'block' level, the sheer volume of traffic will lead to certain numbers of collisions regardless of street features. Though speed limit and slope seem to significantly guide the decision tree splitting as well, it's unlikely to reduce speed limits on faster thoroughfares while mass modification of street slops is close to impossible. The only official recommendation we can make to the city here is make an effort to capture more informative mapping data in incident reports and nuance the Streets metadata further. For example, lane width is a feature included in their dataset, but there is no mention of lane counts. We suspect that space allotted to vehicles is correlated with lower collision rates, the data readily available does not provide this information.
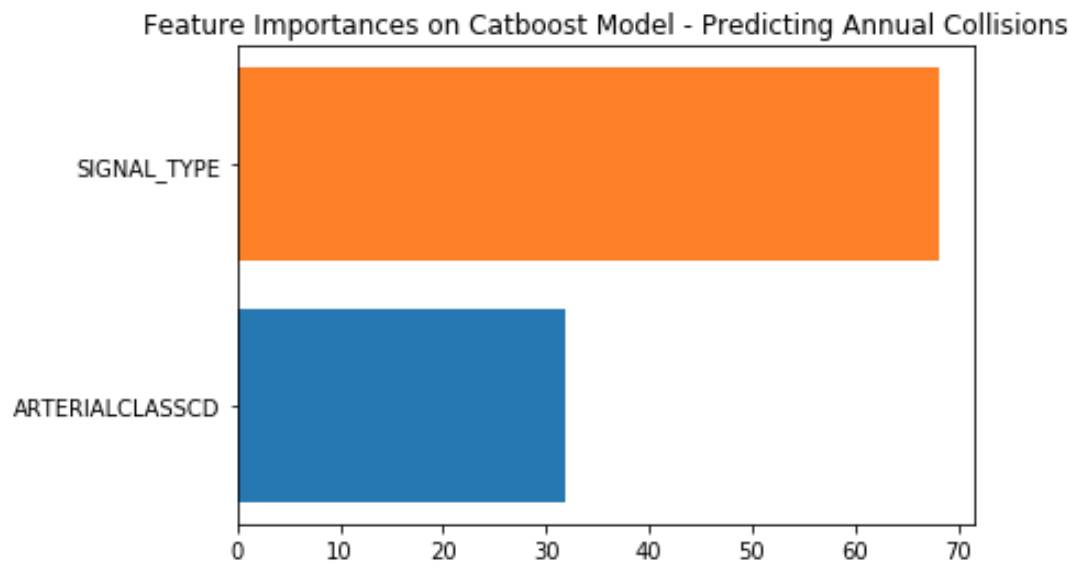
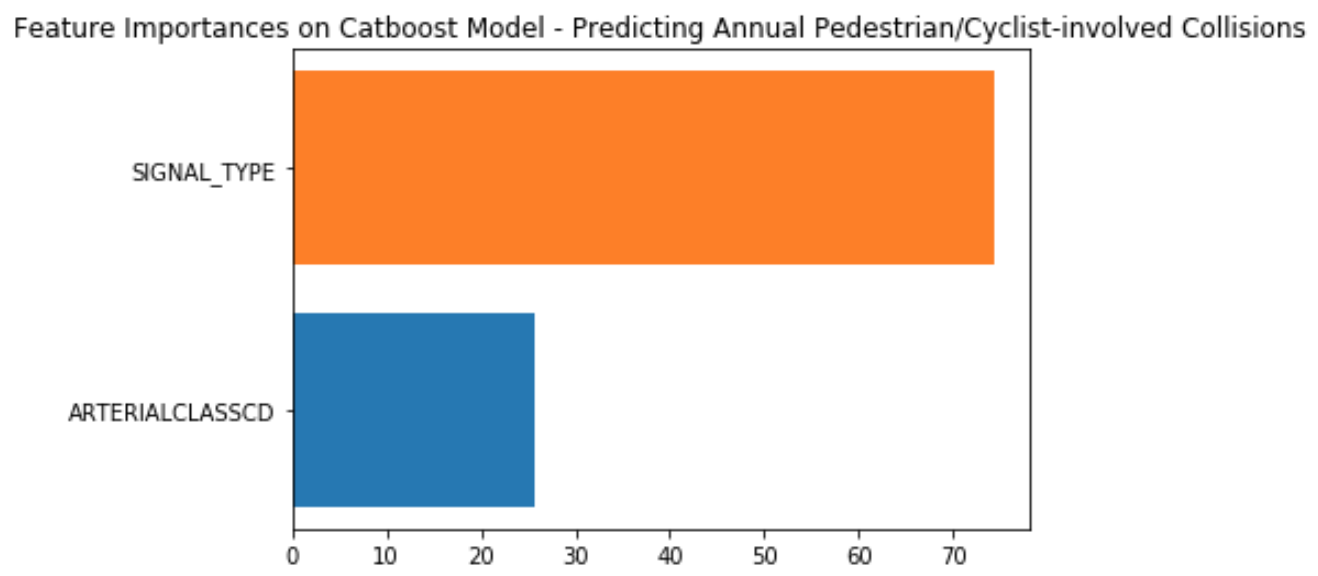
For collisions occuring at intersections, the results intially appeared more fruitful. Signal type is clearly more important here than arterial class here, and even more important for collisions involving pedestrians and/or cyclists. Introducing whether or not an intersection had traffic circles did not provide any more predictive power, most likely owing to it being a feature almost exclusively existing on non-arterial residential streets.
 |
 |
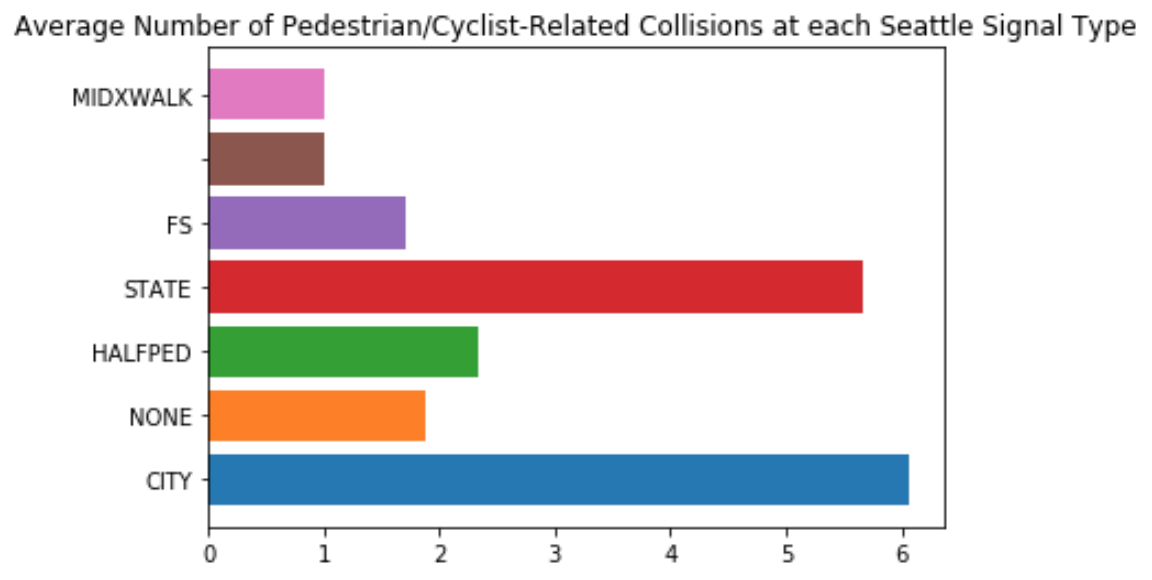 |
It looks like Seattle's 2030 plan to install a lot of pedestrian-first traffic lights seems like an intelligent allocation of resources. Though the distribution of signal types outside of 'City' & 'None' is minimal across Seattle for a proper Machine Learning model, the higher rate at 'State' intersections would not take too many resources to resolve (there are only 31 reported intersections with this signal type). These all fall around highway ramps and we'd suggest making modifications to make traffic signals clearer there. For a more thorough data report on annual collision rates vs different intersection features, checkout this Tableau Dashboard Isaac put together here: https://public.tableau.com/profile/isaac.campbell.smith#!/vizhome/SeattleIntersections/TrafficCirclesAccidentRatesNon-Arterial
If we are to have cohesive findings, we need a cohesive measure of how dangerous a given area is, across the city, regardless of specificities.
We made effort to control for traffic flow in our study to compare generally across features. While the traffic flow data has improved coverage in recent years, we cannot normalize across all the collision incidents with the limited data. However, we devised a different metric to compare generally across features, which could be more useful for comparing across types of road features and arterial classes.
Our method for doing this comparison was to make a severity metric that takes into account number of collisions and gives a larger weight to fatalities, serious injuries and so on.
Here's how we did that for the intersections data:

We see here we weighed fatalities 5x a normal collisions, serious injuries 4x, and so on. We divide by total number of collisions so each metric is on a scale from 0-1. This metric enabled us to label different street features and enable a spot check comparison. However it's not perfect. The majority of the numbers are mere fractions, making comparison and visualization difficult. It's not updatable for new data, as we normalize by the sheer count. The formula could be prone to error across different datasets, so the heuristic would need to be formalized.
- Demographic Data: Collisions are not simply location based unfortunately. People are the other main factors involved in collisions. Looking at the feature importances of the streets, we ran into issues where it simply doesn't give enough prediction power because of either poor data collection or it didn't make a difference.