PSEIpullr is used to pull stock prices of companies listed in the Philippine Stock Exchange via the pselookup API as well as to track portfolio performance. This project was inspired by the lack of available package(s) that can be used to efficiently pull local stock prices.
Massive thanks to Vrymel for maintaining the API. Interested parties can visit his/her website at https://pselookup.vrymel.com/about.
Disclaimer: As the package uses a third-party API, PSEIpullr cannot guarantee data accuracy pulled by the package. PSEIpullr also makes no warranties, representations, statements, or guarantees (whether express, implied in law or residual) regarding the package. The output of the package is simply for monitoring purposes and is not intended to provide investment advice.
You can install the released version of PSEIpullr from CRAN with:
devtools::install_github("CoconutMartin/PSEIpullr")This is a basic example showing how to pull price of stocks listed in the Philippine Stock Exchange:
library(PSEIpullr)

system.time(
  ac <- pull_historical_price(ticker = "AC",
                              type = "close",
                              start_date = "2020-01-01",
                              end_date = "2020-02-01")
)
#>    user  system elapsed
#>    0.25    0.03    1.97

head(ac)
#>         Date    AC
#> 1 2020-01-02 770.0
#> 2 2020-01-03 776.0
#> 3 2020-01-06 785.0
#> 4 2020-01-07 800.0
#> 5 2020-01-08 790.0
#> 6 2020-01-09 794.5
The next function allows for a simplified way of pulling multiple stock prices:
system.time(
  multi_stock <- pull_multiple_prices(tickers = c("AC", "SM"),
                                      type = "close",
                                      start_date = "2020-01-01",
                                      end_date = "2020-12-28")
)
#>    user  system elapsed
#>    0.25    0.08    4.52

head(multi_stock)
#>         Date    AC   SM
#> 1 2020-01-02 770.0 1039
#> 2 2020-01-03 776.0 1051
#> 3 2020-01-06 785.0 1040
#> 4 2020-01-07 800.0 1067
#> 5 2020-01-08 790.0 1055
#> 6 2020-01-09 794.5 1072
The package also allows for basic portfolio construction, analysis, and plotting. Start by setting up a position using the position_tracker() function before combining both positions with portfolio_tracker() to create a basic portfolio data set. portfolio_tracker() performs basic analysis on this data frame for easy plotting but can also return the raw combined data for additional analysis.
tictoc::tic()
ac <- position_tracker(deposit = 1000000,
ticker = "AC",
start_date = "2020-01-02",
shares = 1200,
buying_price = 770,
industry = "Conglomerate",
listing = "Index",
selling_price = 823,
selling_date = "2020-11-30")
sm <- position_tracker(deposit = 1000000,
ticker = "SM",
start_date = "2020-04-30",
shares = 1300,
buying_price = 746,
industry = "Conglomerate",
listing = "Index",
selling_price = 1050,
selling_date = "2020-12-28")
tictoc::toc()
#> 2.59 sec elapsed
basic.port <- portfolio_tracker(ac, sm, summarized=TRUE)
head(basic.port)
#> # A tibble: 6 x 11
#> Date total_deposits total_cash total_position total_ending_po~
#> <date> <dbl> <dbl> <dbl> <dbl>
#> 1 2020-01-02 1000000 76000 924000 924000
#> 2 2020-01-03 1000000 76000 924000 931200
#> 3 2020-01-06 1000000 76000 924000 942000
#> 4 2020-01-07 1000000 76000 924000 960000
#> 5 2020-01-08 1000000 76000 924000 948000
#> 6 2020-01-09 1000000 76000 924000 953400
#> # ... with 6 more variables: total_equity <dbl>, total_gains <dbl>,
#> # daily_gains <dbl>, total_portfolio_return <dbl>, total_daily_return <dbl>,
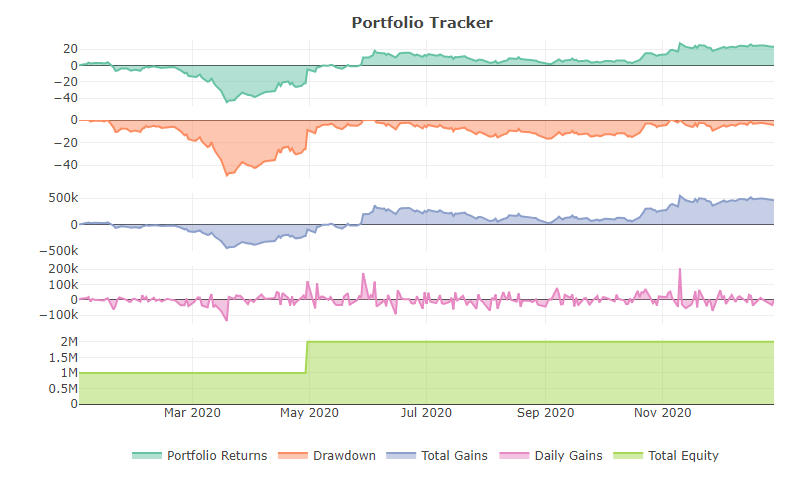
#> # drawdown <dbl>The plot_performance() function allows quick plotting of the summarized portfolio data set.
plot_performance(basic.port)