The Naive Bayes classification algorithm is a probabilistic classifier. It is based on probability models that incorporate strong independence assumptions.Naive Bayes model records how often a target field value appears together with a value of an input field.
The Naive Bayes classification algorithm includes the probability-threshold parameter ZeroProba. The value of the probability-threshold parameter is used if one of the above mentioned dimensions of the cube is empty. A dimension is empty, if a training-data record with the combination of input-field value and target value does not exist.
Gaussian Naïve Bayes is the extension of naïve Bayes. While other functions are used to estimate data distribution, Gaussian or normal distribution is the simplest to implement as you will need to calculate the mean and standard deviation for the training data.
In this project we create a Gaussian Naïve Bayes Model for classification.
DATASET 📑: https://www.muratkoklu.com/datasets/
Article Download (PDF): https://dergipark.org.tr/tr/download/article-file/1227592
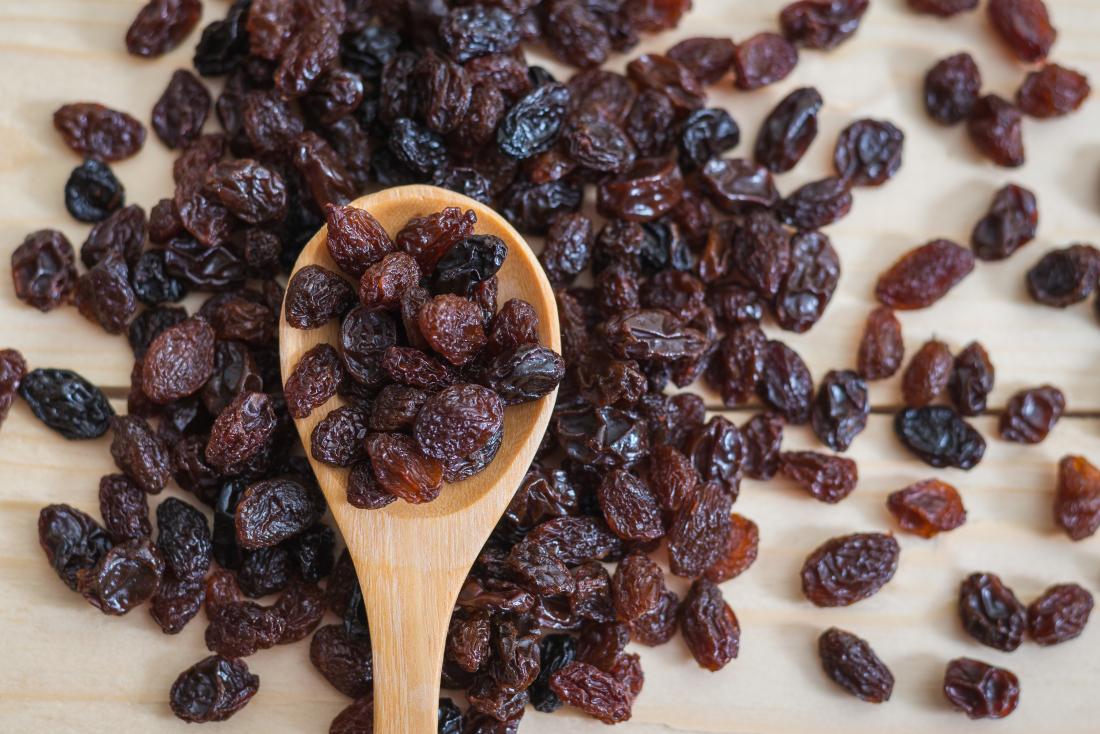
In the study done by CINAR I., KOKLU M. and TASDEMIR S., (2020), machine vision system was developed in order to distinguish between two different variety of raisins (Kecimen and Besni) grown in Turkey. Firstly, a total of 900 pieces raisin grains were obtained, from an equal number of both varieties. These images were subjected to various preprocessing steps and 7 morphological feature extraction operations were performed using image processing techniques. In addition, minimum, mean, maximum and standard deviation statistical information was calculated for each feature. The distributions of both raisin varieties on the features were examined and these distributions were shown on the graphs. Later, models were created using LR, MLP, and SVM machine learning techniques and performance measurements were performed. The classification achieved 85.22% with LR, 86.33% with MLP and 86.44% with the highest classification accuracy obtained in the study with SVM. Considering the number of data available, it is possible to say that the study was successful.
- Area
- MajorAxisLength
- MinorAxisLength
- Eccentricity
- ConvexArea
- Extent
- Perimeter
- Class
- pandas
- seaborn
- matplotlib
- scikit-learn
The performance of the model is calculated using accuracy_score function.It computes the accuracy, either the fraction (default) or the count (normalize=False) of correct predictions.
I have got 87.7% accuracy which I think is pretty good. 👀😄