In this project, the goal is to investigate a classic phenomenon from experimental psychology called the Stroop Effect. Firstly, we will learn a little bit about the experiment, create a hypothesis regarding the outcome of the task, then go through the task. We will then look at some data collected from others who have performed the same task and will compute some statistics describing the results. Finally, we will interpret our results in terms of our hypotheses.
(Image is from Udacity.)
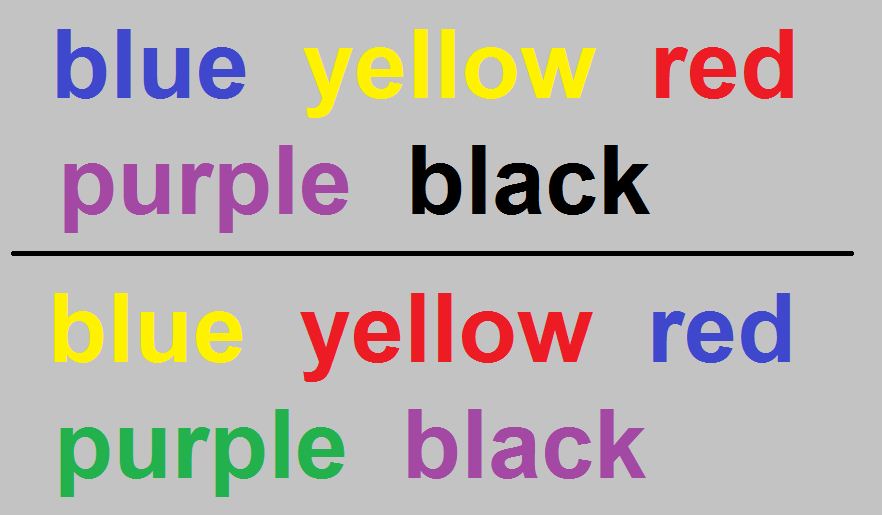
In a Stroop task, participants are presented with a list of words, with each word displayed in a color of ink. The participant’s task is to say out loud the color of the ink in which the word is printed. The task has two conditions: a congruent words condition, and an incongruent words condition. In the congruent words condition, the words being displayed are color words whose names match the colors in which they are printed: for example RED, BLUE. In the incongruent words condition, the words displayed are color words whose names do not match the colors in which they are printed: for example PURPLE, ORANGE . In each case, we measure the time it takes to name the ink colors in equally-sized lists. Each participant will go through and record a time from each condition.
| Table of Contents |
|---|
| Prerequisites 🔍📜 |
| Design 📐 |
| Conclusions 📌 |
| License 🔖 |
- Python 3.6.3
- Jupyter Notebook
- Anaconda-Navigator
The project is going to answer the following questions:
-
1 What is our independent variable? What is our dependent variable?
-
2 What is an appropriate set of hypotheses for this task? Specify the null and alternative hypotheses based on what we think the researchers might be interested in. Justify our choices.
- We can try out the Stroop task for better understanding.
-
3 Report some descriptive statistics regarding this dataset. Include at least one measure of central tendency and at least one measure of variability.
-
4 Provide one or two visualizations that show the distribution of the sample data. Write one or two sentences noting what we observe about the plot or plots.
-
5 Now, perform the statistical test and report our results. What is our confidence level or Type I error associated with our test? What is our conclusion regarding the hypotheses we set up? Did the results match up with our expectations?
-
6 Optional: What is responsible for the effects observed? Can we think of an alternative or similar task that would result in a similar effect? Some research about the problem will be helpful for thinking about these two questions!
-
According to the statistical analyze, we reject the Null Hypothesis, which is to say the time spent on Incongruent condition is significantly higher than that of Congruent condition.
-
It makes sense, as from my own anecdotal experience incongruent words requires more time for recognition as the words displayed are color words whose names do not match the colors in which they are printed.
