Sootty is a graphical command-line tool for visualizing waveforms from hardware simulations, as a substitute for waveform visualizers like Verdi and GTKWave. It is designed with a focus on being lightweight and easy to use, and takes advantage of modern terminals’ capabilities to provide a clean graphical display. Current features include:
- Customizable display style
- Search and highlight events using a simple query language
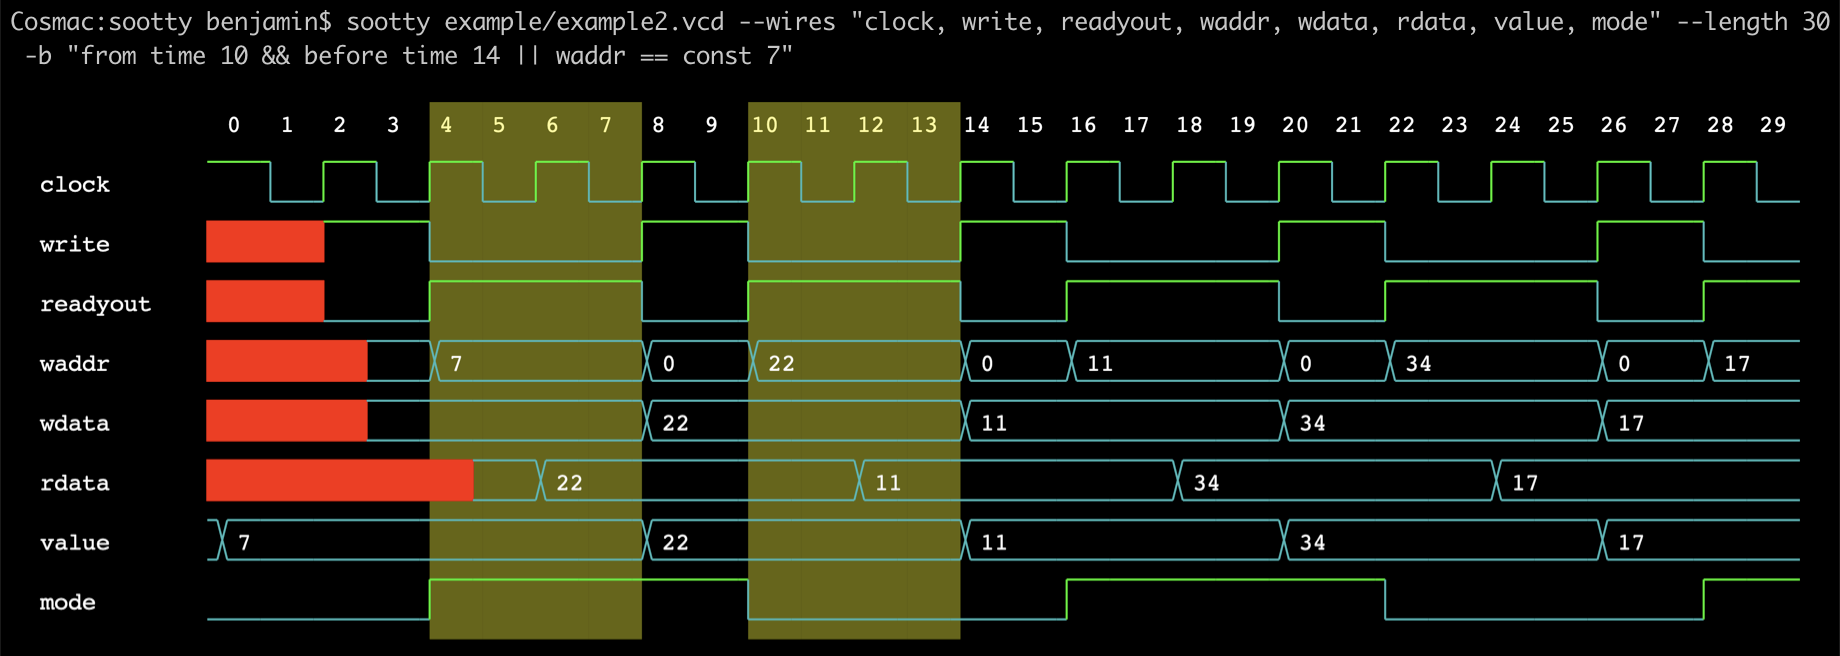
And here's an example of how sootty can be used directly from the terminal:
- Install sootty using pip:
pip install sootty- Display a waveform file to the terminal:
sootty "waveform.vcd" -o > image.svgOptional arguments include:
-s | --start FORMULASpecify the start of the window.-e | --end FORMULASpecify the end of the window.-l | --length NSpecify the number of ticks in the window (mutually exclusive with-e).-o | --outputPrint svg data tostdoutrather than display on terminal.-w | --wires LISTComma-separated list of wires to include in the visualization (default to all wires).-b | --break FORMULASpecify the formula for the points in time to be highlighted.-r | --radix NDisplay values in radix N (default 10).-S | --save SAVENAMESaves current query for future reuse.-R | --reload SAVENAMELoads a saved query. Requires query name as string.--btablePrint the wire value table at breakpoints tostdout(-bis required).
*Note: For more detailed information on the query language, check out syntax.md
Below are some more examples that take advantage of some of the features sootty has to offer:
- Display all wires starting at time 4 and ending at wire
clk's tenth tick:
sootty "example/example3.vcd" -s "time 4" -e "acc clk == const 10" -w "clk,rst_n,pc,inst"- Display wires
DataandD1for 8 units of time starting whenDatais equal to 20:
sootty "example/example1.vcd" -l 8 -s "Data == const 20" -w "D1,Data"- Saving a query for future use:
sootty "example/example2.vcd" -s "rdata && wdata == const 22" -l 10 -w "rdata, wdata" -S "save.txt"- Reloading a saved query:
sootty -R "save.txt"- Add breakpoints at time 9, 11, and 16 - 17 and print wire values at breakpoints:
sootty "example/example5.evcd" -b "time 9 || time 11 || after time 15 && before time 18" --btableSootty can also be run from within a python program:
from sootty import WireTrace, Visualizer, Style
from sootty.utils import evcd2vcd

# Create wiretrace object from vcd file:
wiretrace = WireTrace.from_vcd_file("example/example1.vcd")

# Convert wiretrace to svg:
image = Visualizer(Style.Dark).to_svg(wiretrace, start=0, length=8)

# Display to stdout:
image.display()

# Manually convert EVCD file to VCD file:
with open('myevcd.evcd', 'rb') as evcd_stream:
    vcd_reader = evcd2vcd(evcd_stream)
    with open('myvcd.vcd', 'wb') as vcd_stream:
        vcd_stream.write(vcd_reader.read())
Note: You can view and modify the save files for the queries in the ~/.config/sootty/save directory.
As of the current release, Sootty can only display images in certain terminals with builtin graphics support. This currently includes the following terminal replacements:
The following external dependencies are also needed to properly display images within the terminal:
-
# From source (rust package manager)
cargo install viu
# MacOS
brew install viu
# Arch Linux
pacman -S viu
-
rsvg-convert
# Ubuntu
apt install librsvg2-bin
# MacOS
brew install librsvg
If you are interested in contributing to this project, feel free to take a look at the existing issues and submit a PR. Beginners are encouraged to focus on issues with the "good first issue" label. This project has also been involved with Google Summer of Code through the FOSSi Foundation. Check out our project idea for GSoC '23: https://www.fossi-foundation.org/gsoc23-ideas#enhancing-the-sootty-terminal-based-graphical-waveform-viewer