In December 2018 we published an article showing 7 ways in which cuts had changed council spending. Tom Calver provided additional analysis and visualisation.
The cleaning, combination and analysis was largely done in R. You can find a number of notebooks and R scripts in this repo, with descriptions below.
- Most of the data was taken from the Local authority revenue expenditure and financing collection, going back to 2010-11
- Copies of the spreadsheets can be found in this repo, each beginning with 'Revenue_Outturn_Summary__RS__data'. The 2017/18 data is named RS_2017-18_data_by_LA.xlsx
- Kathy Evans, chief executive, Children England
- Spokesperson, County Councils Network
- Spokesperson, The Ministry of Housing, Communities and Local Government (MHCLG)
- Spokesman, Local Government Association
- Stacked bar chart: spend per person on each service across England 2017/18
- Multiple filled line charts: spend per person on each service, 2010/11 - 2017/18
- Multiple bar chart: Spending by councils in 2010/11 vs 2017/18, as pence in pound, by service
- Line chart: average Band D council tax in England, 2010/11 - 2018/19
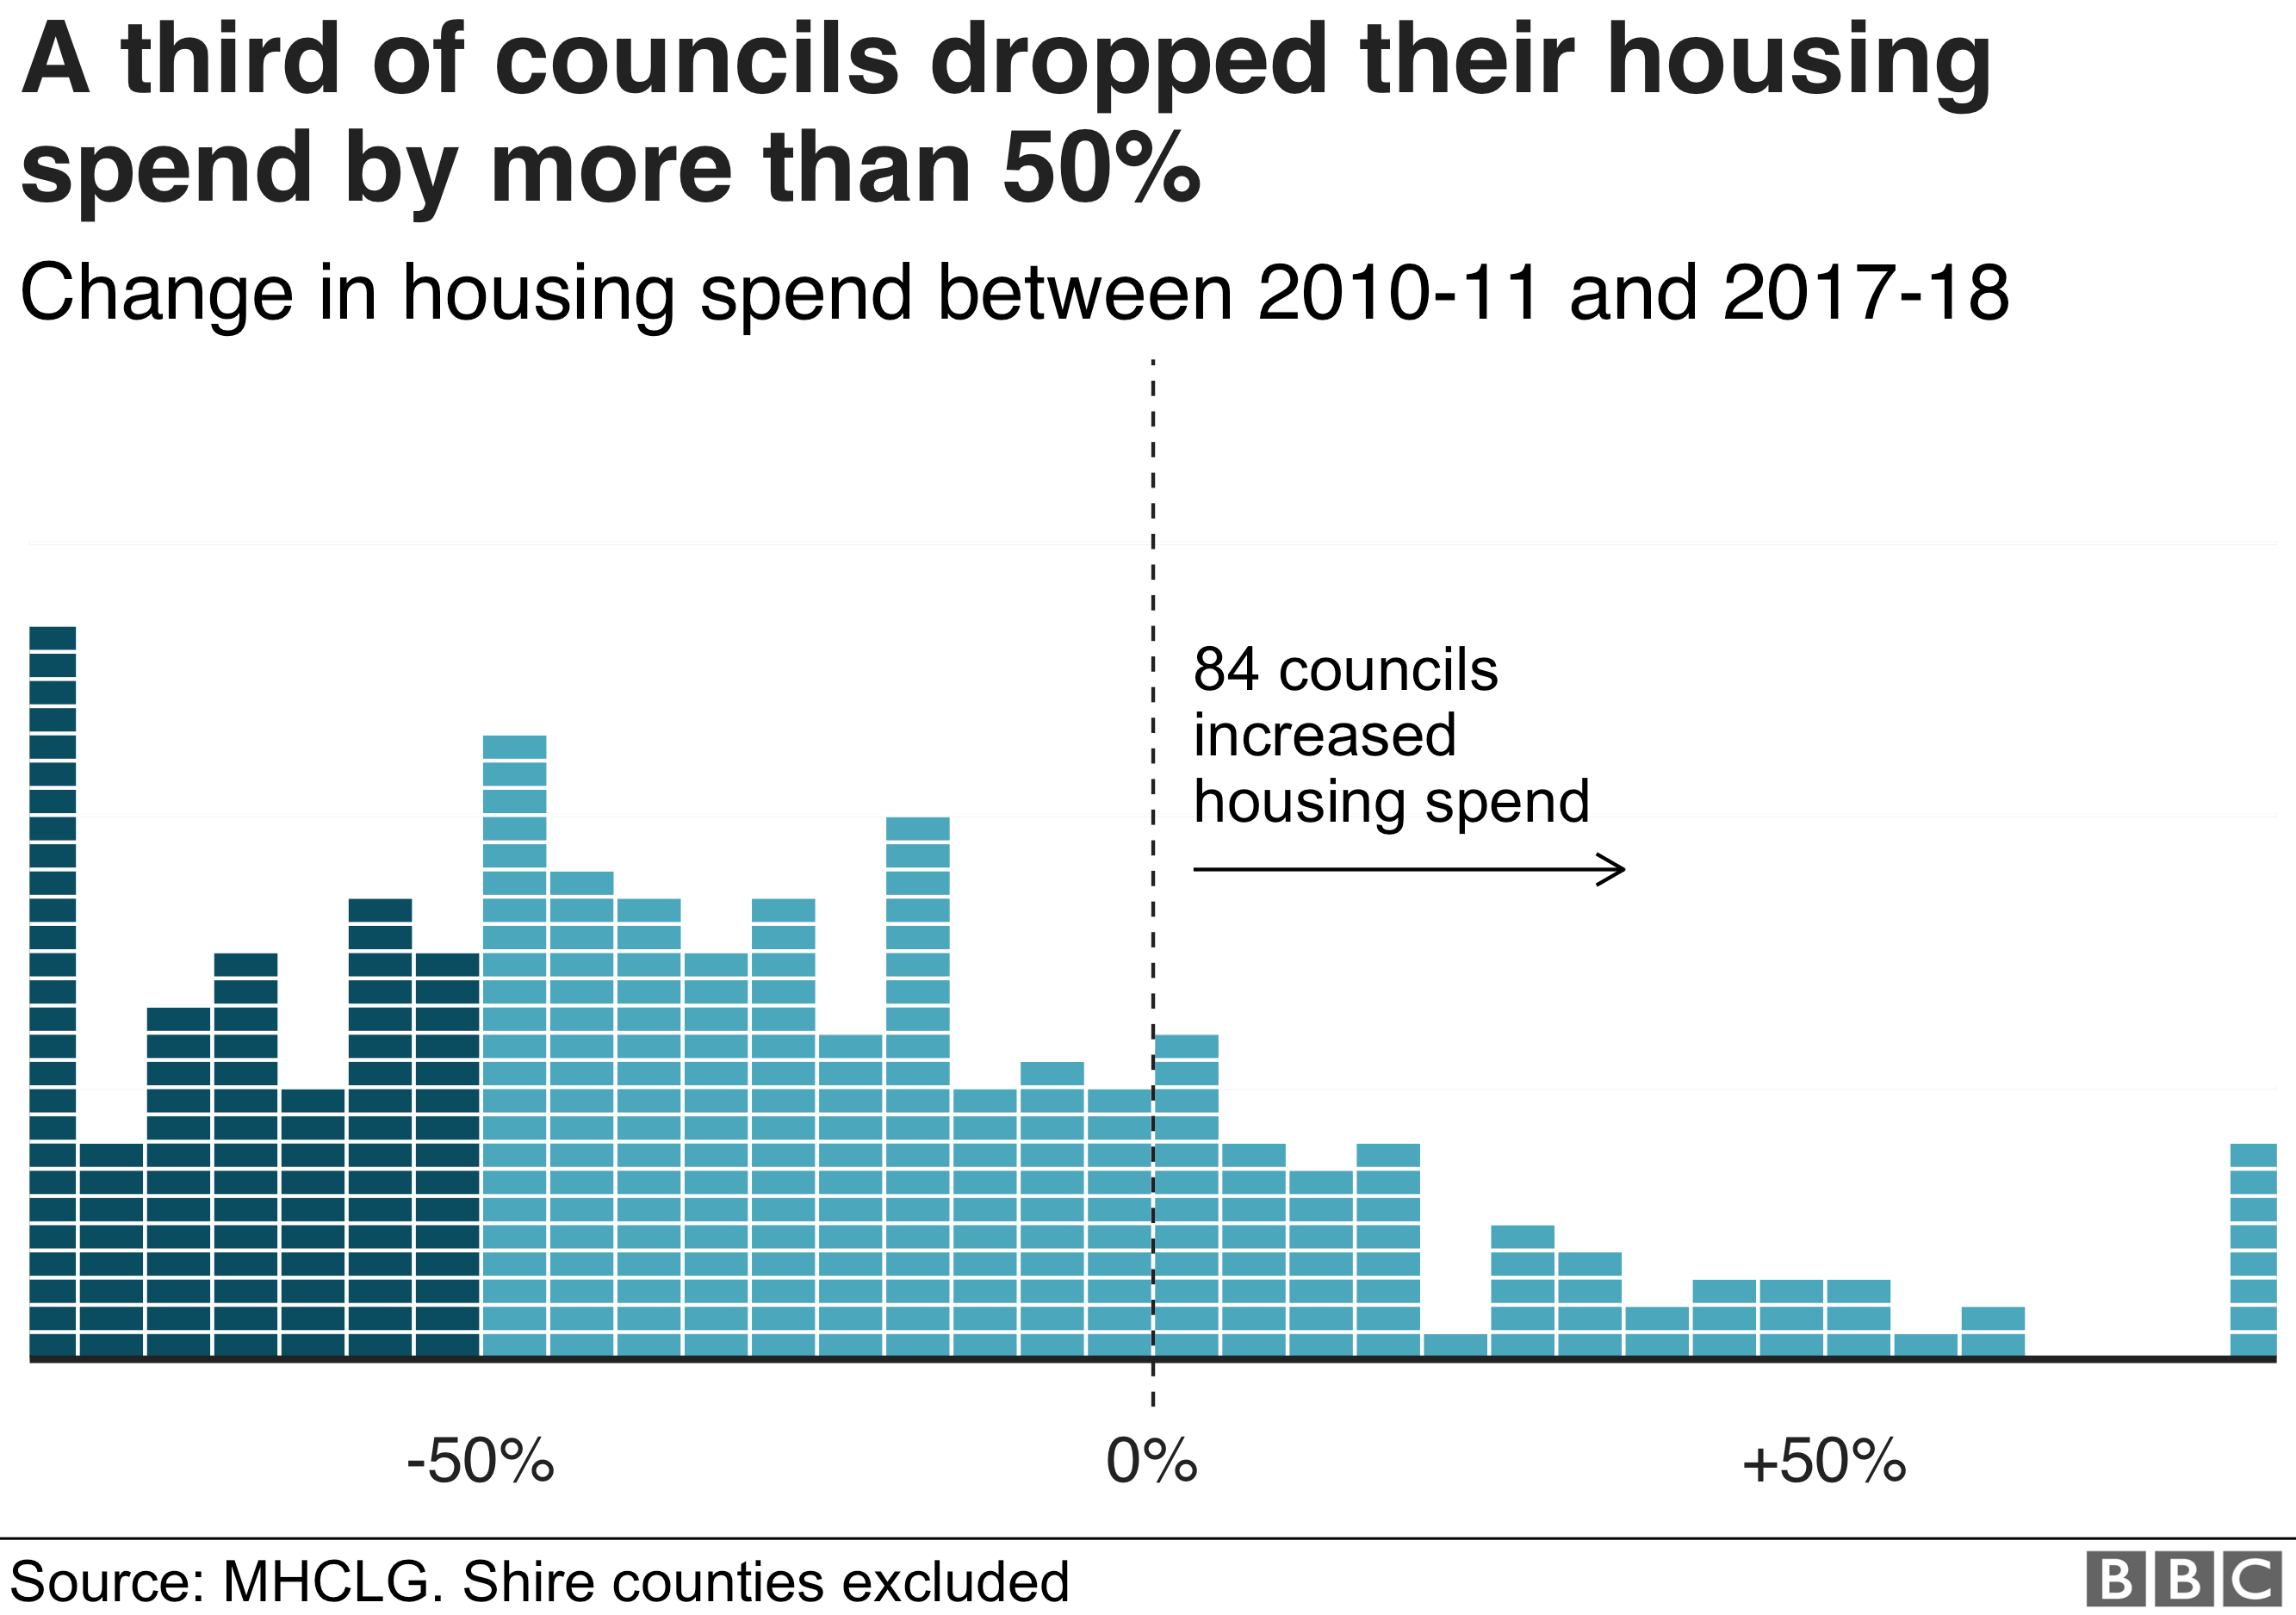
- Histogram: distribution of change in housing spend, 2010/11 - 2017/18
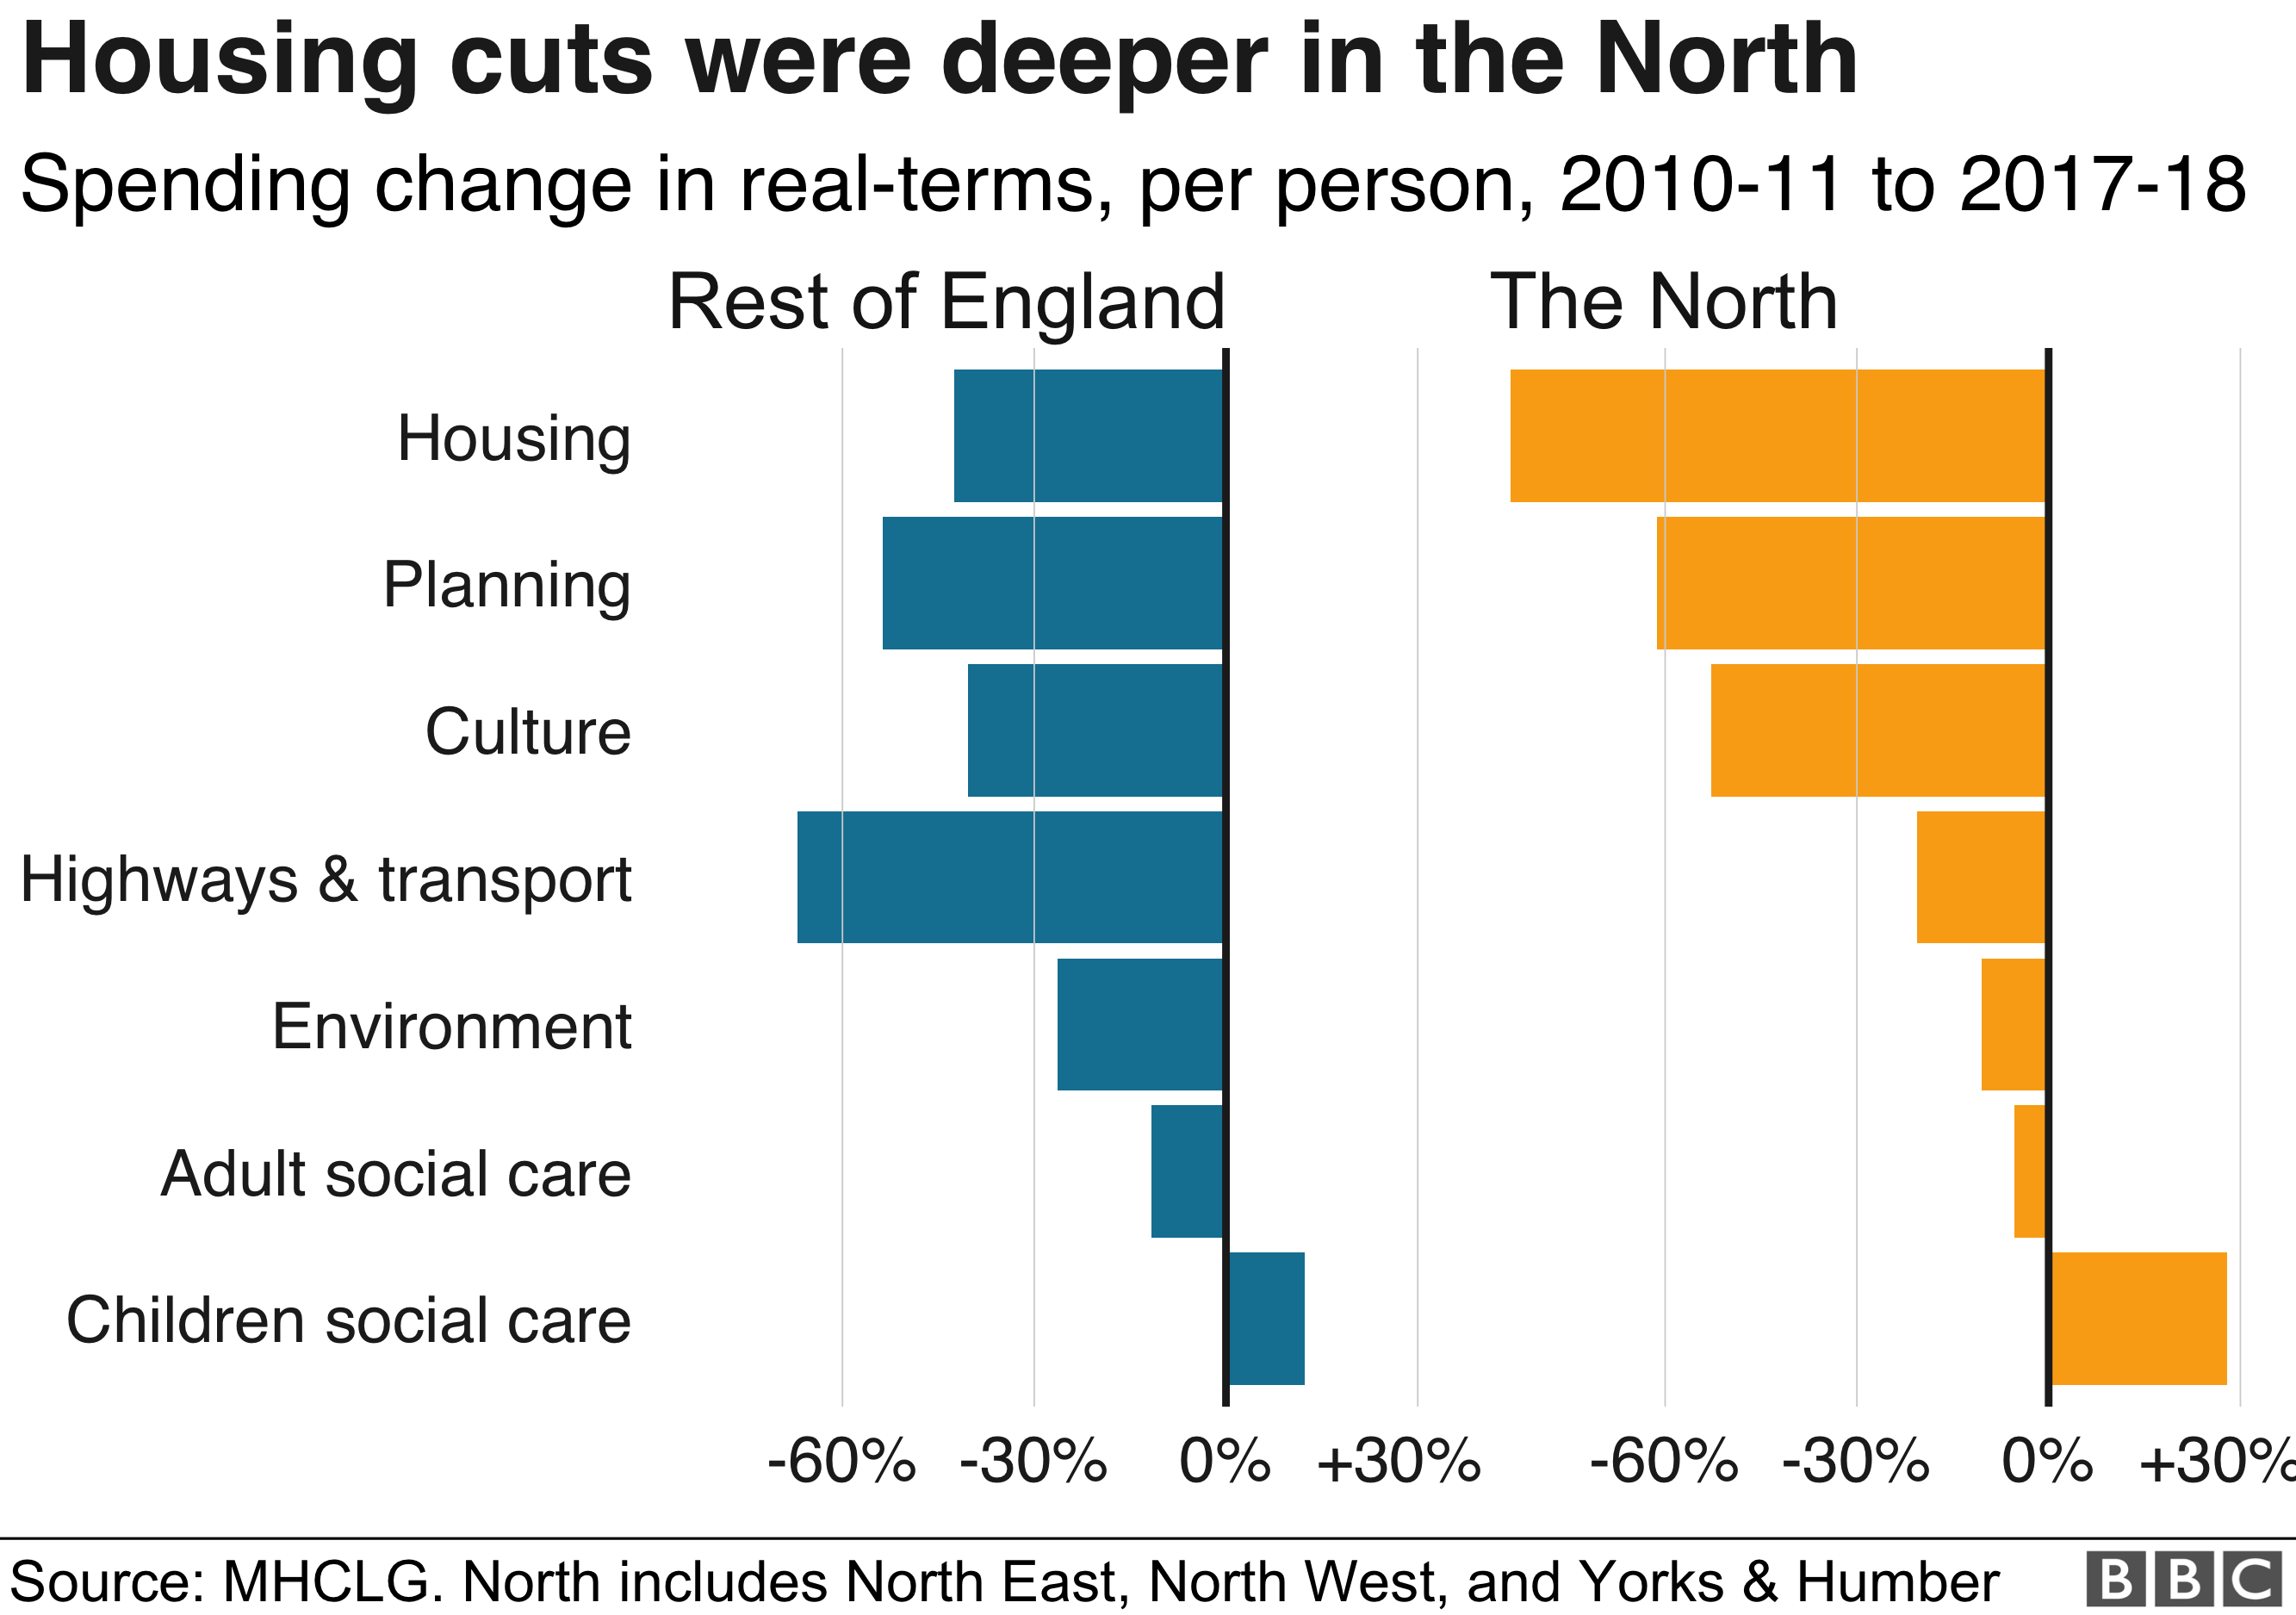
- Multiple bar chart: Spending change in real terms, per person 2010/11 - 2017/18: North vs Rest of England
- Histogram: distribution of usable reserves as a percentage of 2017/18 spending
- The notebook 1downloadcleanaccounts.Rmd details the process of downloading, cleaning, and analysing council accounts.
- The notebook 1bcombineaccounts.Rmd details the process of combining the council accounts.
- The notebook 1ccombineaccounts_cbind.Rmd details the process of combining council accounts using
cbind. This process was not used in the end, however, as using the uncombined accounts withsqldf(below) was a much simpler and more flexible approach - The notebook 1ccombineaccounts_sqldf.Rmd details the process of querying multiple council accounts to make comparisons.
- The notebook 2analyseaccountsDANamended.Rmd outlines the process of analysing the accounts further
- The R function script stripbackro.horiz.R takes an Excel filename and a year, then returns a subset for main categories of spending with the year added as a prefix for the columns
- The R script givemesqlquery.fromto.R will, given a column name, and the names of 2 data frames, generate a SQL query that will generate #a table showing change from one data frame to another