IVIS is an open-source chart editor for interactive visualisation. It uses jQuery and HighCharts as the backbone. It works purely on the client side, and all data will be processed locally only. Webpages for IVIS were generated with Hugo.
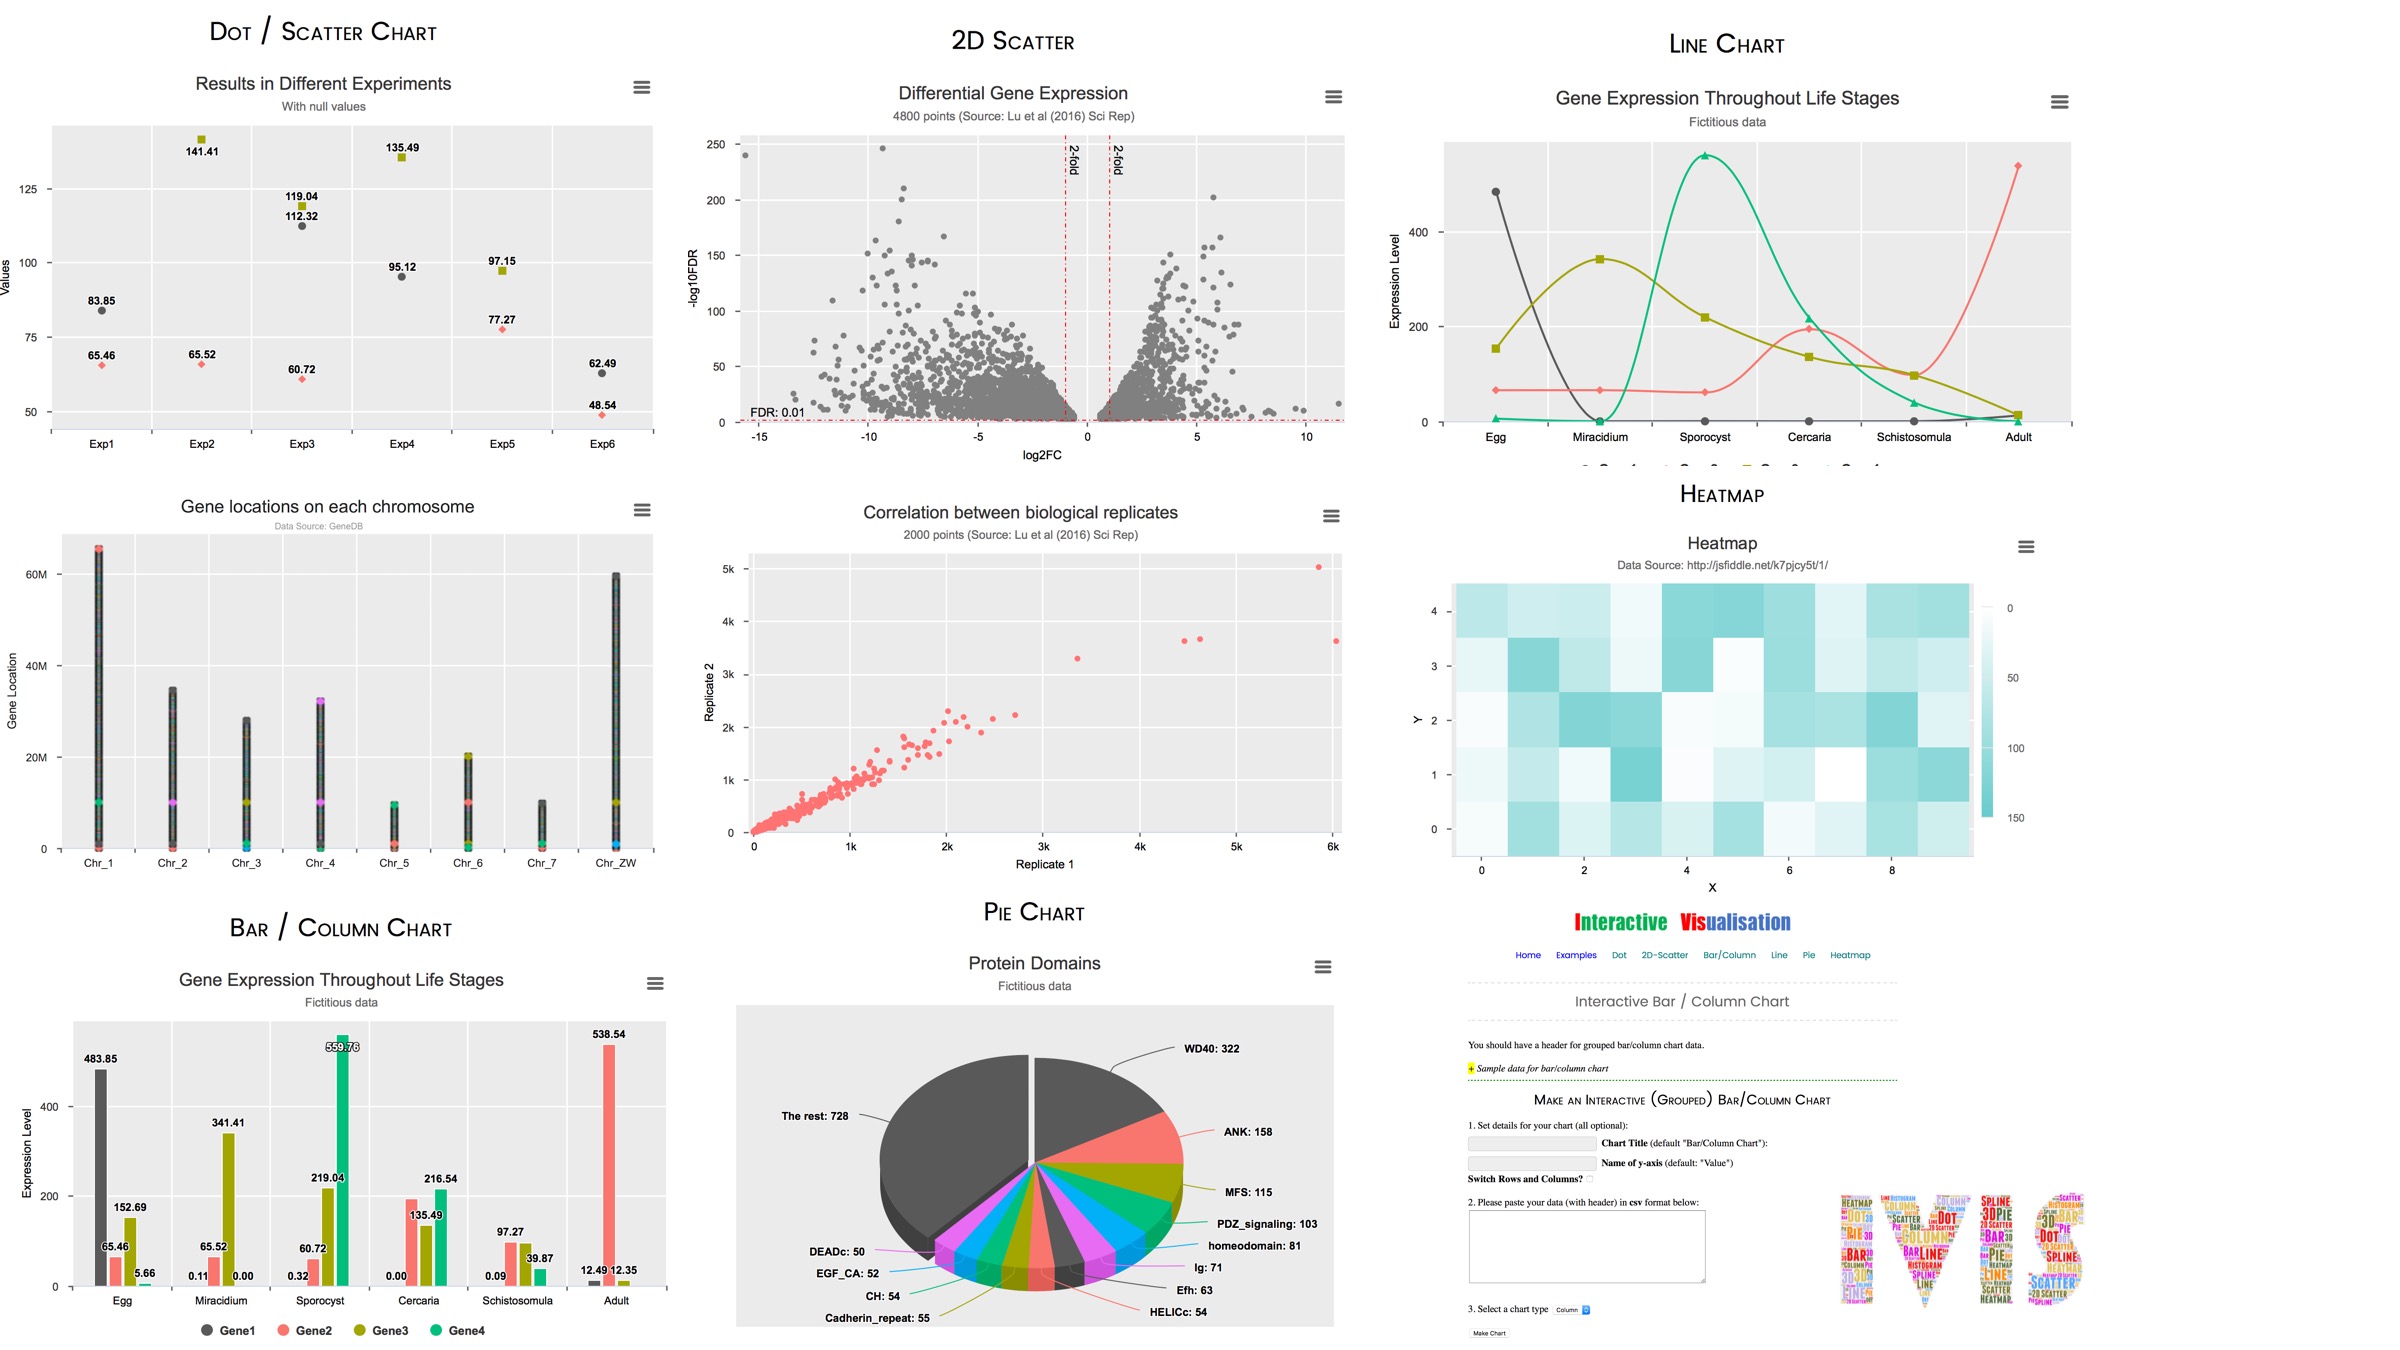
- Dot / Scatter plot: X as names and Y holding one or more values
- 2D Scatter (XY Plot) using X-Y paird values, such as volcano plot, MA plot, 2D PCA, correlation chart, standard curve and so on
- 3D Scatter plot XYZ data
- Bar / Column chart: can use grouped data
- Line chart: multiple series can be plotted
- Pie chart: in 2D or 3D
- Heatmap fast overview of many data points
- There are tooltips showing X, Y and/or series name whenever you move your mouse over the data
- You can zoom in at any area to see details, the X/Y scales will change accordingly
- Each data point can be linked to any external information page, which saves you much manual query effort
- You can hide / show certain series
- You can print or download the chart in various formats, including PDF, PNG, JPEG and SVG at publication resolution
- The chart is responsive, you can even make your chart on your mobile phone or tablet
- You can configure the editor to fit your own needs (requires knowledge in JavaScript and HTML/CSS)
IVIS directly takes user data from the input box. Data can be comma-, tab-, or space-separated values. There is a function to swape the rows and columns when necessary.
Exemplary charts and sample data input are availabe for users to start with.
One way to run IVIS locally is to save the webpage to a local machine and open with your web browser.
Another way is to clone or download this repo, and run with Hugo server:
## install Hugo
brew install hugo

## run Hugo in this directory
hugo server
Users can now export the html code of their chart and integrate it into HTML slides. Many HTML frameworks can be used, including reveal.js, remark.js, deck.js, webslides, etc. An easy-to-use integration tool is IPRES.
- conditional color for scatters
- pie chart drilldown
IVIS is released under the CC-BY-NC 4.0 license and MIT License.