


A Data Analytics & Visualisation Expert 📈
I bring data to life with:
- Tableau
- SQL
- Python

Over on YouTube, I've created several SQL challenge walkthroughs to help newcomers learn when and why to use different techniques.
Here you'll find how to:
- Solve a murder with SQL 📺 Watch
- Support a pizza business 📺 Watch
- Prep data for bank reporting 📺 Watch
And many more!
In 2021 I teamed up with two members of the Tableau community to launch a project combining data visualization and games, #GamesNightViz.
A quick way to grow your skills is to work on a topic you enjoy, and games provide plenty of opportunities for fun, intrigue, and great visualizations.
Here you'll find data about:
- The population of Skyrim 🔗 Data
- All the songs from Just Dance 🔗 Data
- And a ton of Mario games 🔗 Data
I have been working for over a decade in data analytics, I enjoy solving problems with data, be that automating processes with SQL, R & Python or visualising data with Tableau.
During my career, I have:
- Enabled companies from sectors such as finance, media and research to extract value from their data.
- Won the title in the world’s biggest data visualization contest, Tableau’s Iron Viz, in 2022.
- Trained analysts to solve problems and craft their own data stories.
Away from the desk, I am a regular speaker at user group events and conferences, I stay up to date on the latest in the data analytics space, regularly sharing my thoughts on emerging tools and techniques.
I’m always open to connecting with fellow data enthusiasts, discussing challenges and exploring collaborative opportunities.


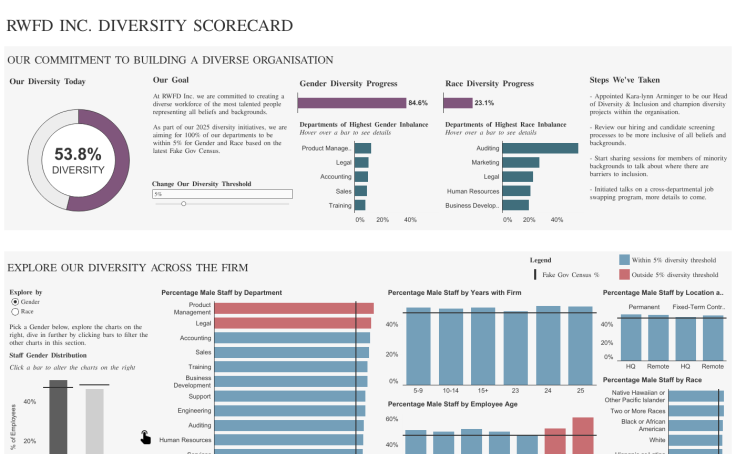
I travelled to Las Vegas to compete in the largest data visualization contest globally, Tableau's Iron Viz competition. The final round required presenting a 20-minute Tableau dashboard before a live audience of 5,000 and a global streaming audience.
This year's theme focused on visualizing the impact of education worldwide. Leveraging animations, parameters, and map background images, I crafted a presentation-style visualization to effectively communicate my analysis.


You can find me on the following social media sites