You need the WildFly Swarm examples. Make sure they are fully build.
Most of the process monitoring is done using sigar. It requires a native library to be present: (hyperic-sigar-1.6.4, https://sourceforge.net/projects/sigar/)
-Djava.library.path=./libs/
Build the top level project first:
mvn clean package
usage: Monitor [-a <arg>] -b <arg> [-n <arg>] [-o <arg>] [-skip] -w <arg>
WildFly Swarm Performance Monitor
 -a,--archive <arg>             the directory with previous performance
                                results
 -b,--base <arg>                the WildFly Swarm examples directory
 -n,--number-iterations <arg>   number of iterations per test
 -o,--output <arg>              the .csv file to store the current test
                                results
 -skip,--skip-tests             skip test execution phase
 -w,--workdir <arg>             where to store testing artifacts
Or simply use the run script (assumes sigar in $HOME):
./run.sh -b <PATH_TO_EXAMPLES> -a archive/ -o target/perf.csv;
This will take some time and if everything goes well,
create the test summary at target/perf.csv
The default test driver compares the current execution with the most recent in the archive directory:
example-datasource-subsystem-swarm.jar      : start      -12.0% (6975.5 -> 6195.0)
example-jpa-jaxrs-cdi-war-swarm.jar         : start      +10.0% (7658.25 -> 8487.25)
example-jpa-jaxrs-cdi-shrinkwrap-swarm.jar  : start      +24.0% (7308.75 -> 9095.5)
example-jaxrs-cdi-swarm.jar                 : start      +12.0% (6840.75 -> 7691.25)
demo-0.0.1-SNAPSHOT.jar                     : start      -4.0% (7116.0 -> 6789.75)
example-servlet-cdi-swarm.jar               : start      +29.0% (6656.25 -> 8653.0)
example-messaging-mdb-swarm.jar             : start      +5.0% (8393.75 -> 8833.0)
example-jaxrs-war-swarm.jar                 : start      -0.0% (6142.5 -> 6094.0)
example-datasource-subsystem-swarm.jar      : mem        +2.0% (263.0 -> 270.5)
example-jpa-jaxrs-cdi-war-swarm.jar         : mem        +22.0% (342.25 -> 417.75)
example-jpa-jaxrs-cdi-shrinkwrap-swarm.jar  : mem        +28.0% (323.0 -> 416.25)
example-jaxrs-cdi-swarm.jar                 : mem        +18.0% (282.5 -> 333.5)
demo-0.0.1-SNAPSHOT.jar                     : mem        -1.0% (467.5 -> 461.75)
example-servlet-cdi-swarm.jar               : mem        +14.0% (264.25 -> 301.75)
example-messaging-mdb-swarm.jar             : mem        +3.0% (376.25 -> 391.0)
example-jaxrs-war-swarm.jar                 : mem        +3.0% (249.0 -> 257.5)
There have been test errors. See previous logs for details ...
Exception in thread "main" org.wildfly.swarm.proc.ThresholdExceeded: 8 test(s) did exceed the 10.0% tolerance.
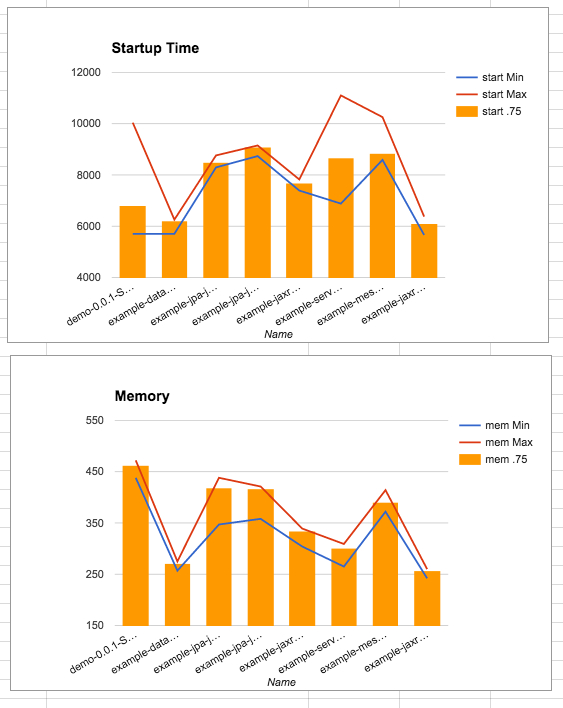
The actual result file is a simple CSV document.
If you put that into a spread sheet it should be straightforward to compare performance baselines of the different WildFly Swarm releases:
Have fun.