
Painlessly plot networks on a brain in python. The package is still in early development and better documentation/tutorials/examples are in the works.
See homepage for more details, examples, documentation
See Network Neuroscience paper for a general turorial
From V0.2.1 keyword arguments now include underscores after the figure component to enhance readability. This means 'nodealpha' becomes 'node_alpha', 'templatevoxelsize' becomes 'template_voxelsize'.
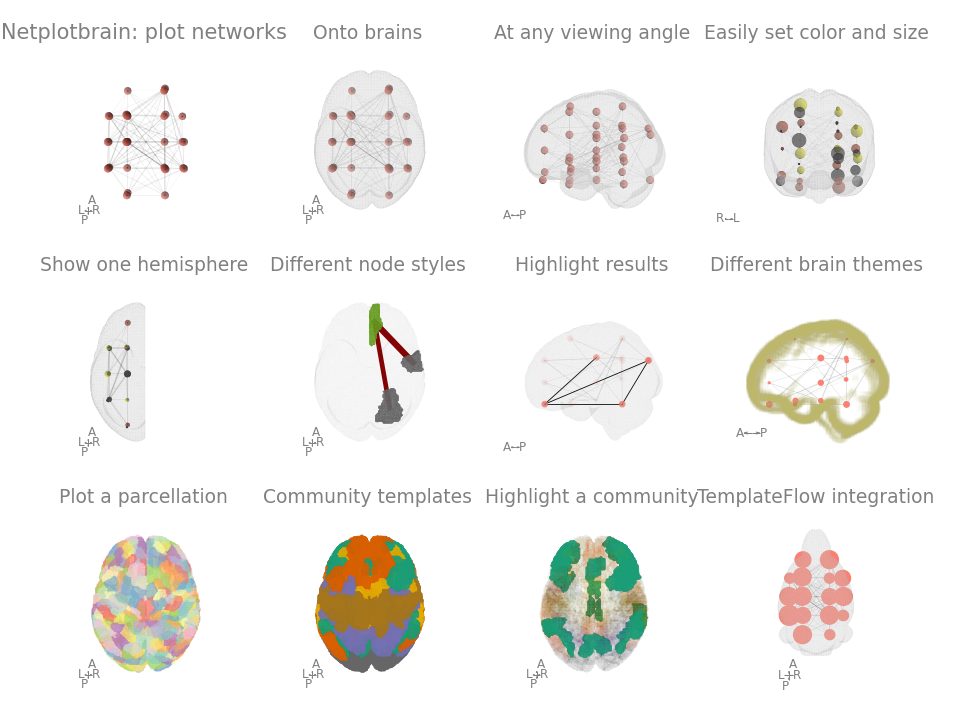
- Easy to specify properties: integration with pandas entails node and edge size/colour can easily be specified.
- Flexibility: multiple node and template styles. Easily create multiple angles to view the figure.
- TemplateFlow integration to download any template or atlas.
pip install netplotbrain
Add the -U flag to upgrade from an earlier version.
Works best in python 3.9 and up.
We hope to develop this package. Please feel free to get in touch about what feature you want/would like to implement/would like to contribute to.
If using netplotbrain in an academic article, please cite the package and the libraries it relies on.
Suggestion of text in methods section:
Network plots were generated using netplotbrain (Fanton & Thompson 2023), which utilizes templateflow (Ciric et al 2021), matplotlib (Hunter 2007), pandas (McKinney 2011), numpy (Harris et al 2020), scipy (Virtanen et al 2020), nibabel (Brett et al 2020), and scikit-image (van der Walt et al 2014).
Brett, Matthew, Markiewicz, Christopher J., Hanke, Michael, Côté, Marc-Alexandre, Cipollini, Ben, McCarthy, Paul, et al (2020, November 28). nipy/nibabel: 3.2.1 (Version 3.2.1). Zenodo. http://doi.org/10.5281/zenodo.4295521
Ciric, R., Lorenz, R., Thompson, W. H., Goncalves, M., MacNicol, E., Markiewicz, C., ... & Esteban, O. (2021). TemplateFlow: a community archive of imaging templates and atlases for improved consistency in neuroimaging. bioRxiv.
Fanton, S., & Thompson, W. H. NetPlotBrain: A Python package for visualising networks and brains. Network Neuroscience, 1-21.
Harris, C. R., Millman, K. J., van der Walt, S. J., Gommers, R., Virtanen, P., Cournapeau, D., ... & Oliphant, T. E. (2020). Array programming with NumPy. Nature, 585(7825), 357-362.
Hunter, J. D. (2007). Matplotlib: A 2D graphics environment. IEEE Annals of the History of Computing, 9(03), 90-95.
McKinney, W. (2011). pandas: a foundational Python library for data analysis and statistics. Python for High Performance and Scientific Computing, 14(9), 1-9.
Van der Walt, S., Schönberger, J. L., Nunez-Iglesias, J., Boulogne, F., Warner, J. D., Yager, N., ... & Yu, T. (2014). scikit-image: image processing in Python. PeerJ, 2, e453.
Virtanen, P., Gommers, R., Oliphant, T. E., Haberland, M., Reddy, T., Cournapeau, D., ... & van Mulbregt, P. (2020). SciPy 1.0: fundamental algorithms for scientific computing in Python. Nature methods, 17(3), 261-272.