Last year, the dashboard project was about finding the general insights of the public endpoint's datacore. This year, it is the extension for querying the endpoints and creating multiple dashboards. The limitation of last year's project was that, there were no customized SPARQL queries that could return the different datasets and visualize them at the same time. All the queries were statically executed without any modifications. Additionally, users had no flexibility to create their own multiple dashboards for analysis.
In terms of solution, this project is about introducing user authentication just like DBpedia's databus where users can login and have their own data collections. The underlying user base for this project remains same as DBpedia Databus'. On the other hand, the frontend (ReactJS) of the application provides users an interface to create dashboards, specify different SPARQL endpoints, and visualize the response of SPARQL queries. Furthermore, the backend (Flask) includes APIs to perform database operations for the dashboards. Hence, the current status and scope of the project includes user authentication and APIs for frontend data visualization along with the backend database. With this foundation, the project holds potential to expand in terms of adding advanced visualizations and data transformation operations.
-
The first major component of this project is the keycloak authentication. There is no need for users to register in order to use this platform because the credentials of DBpedia's databus are used in order to authenticate. For this, keycloak's frontend client is used as per the documentation. Hence, this is the major entry point for the platform.
-
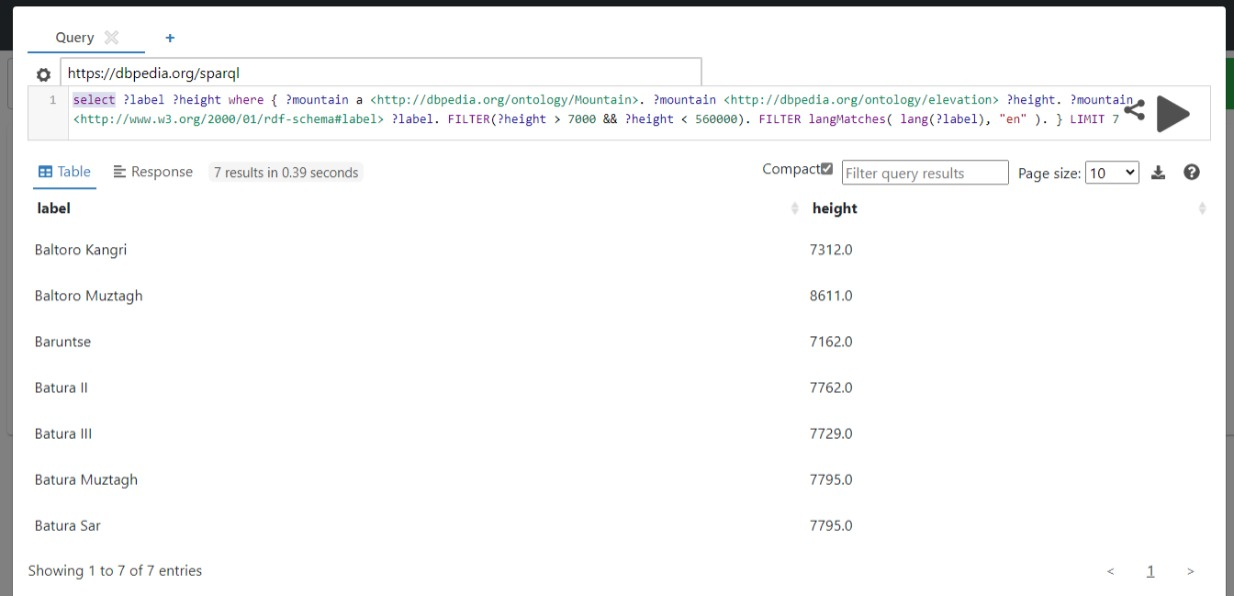
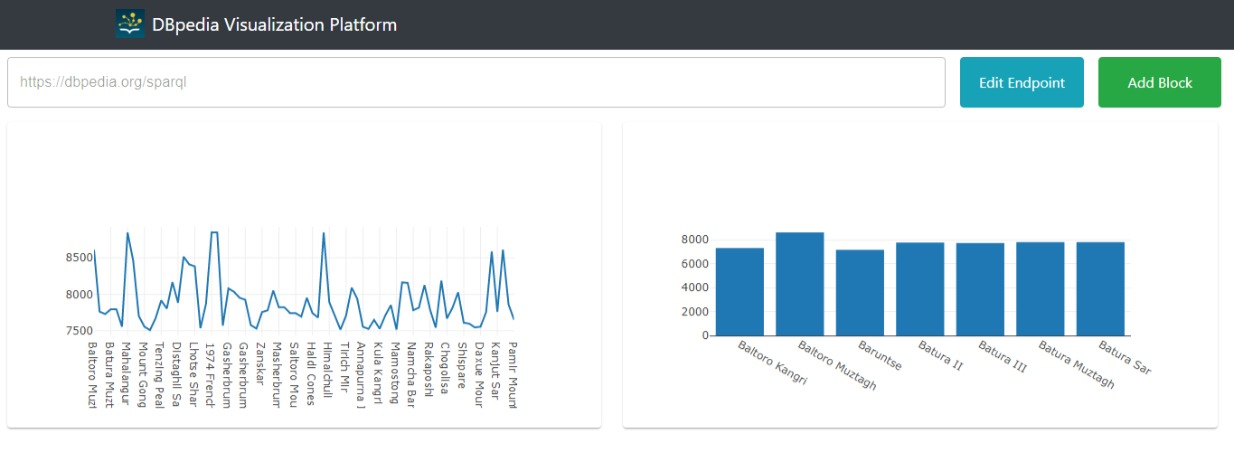
Next, the frontend (user interface) of the application is developed using ReactJS and material design. The frontend contains two components namely YASQE and Plotly data visualization library. YASQE is the SPARQL query editor that efficiently executes the SPARQL queries and provides users an interface to view the results in a readable format. It also allows users to define multiple endpoints and execute queries on them in parallel. As it is a standard query editor, it shows prints the error messages if there are issues while executinig the SPARQL queries. For plotting the data, plotly library is used. At present, there are only basic data visualizations.
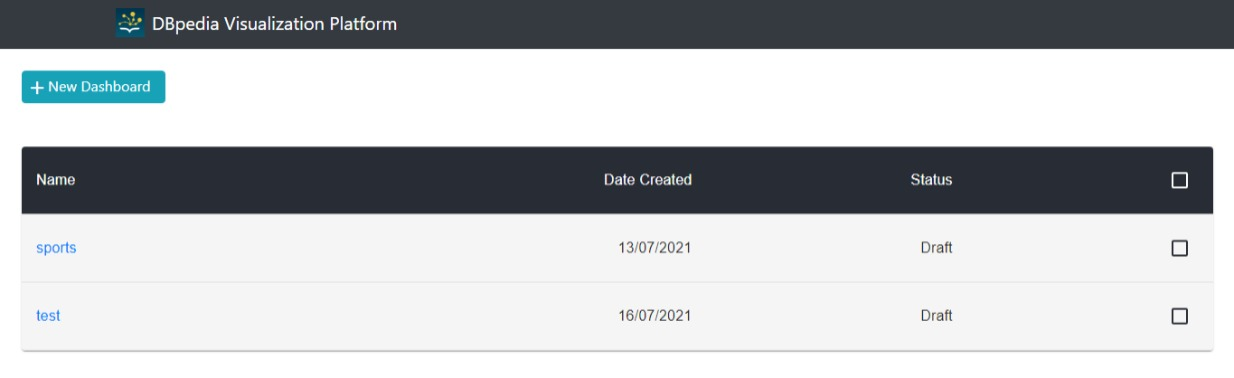
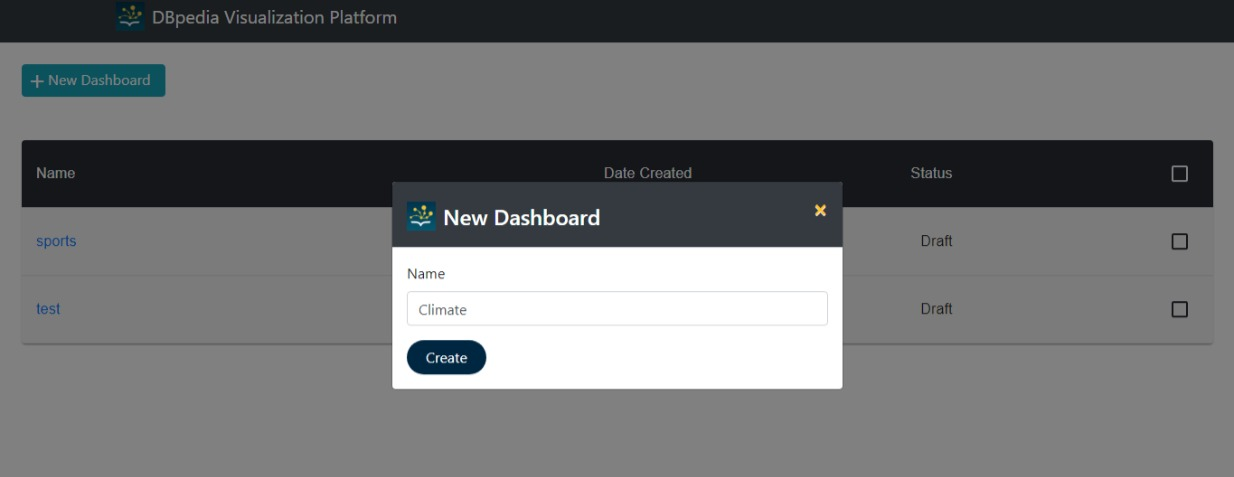
- Finally, the backend of the application contains the APIs that are responsible for interacting with the database. Currently, users can create dashboards and add blocks to them. Here, the blocks represent a set of properties (i.e., SPARQL queries, selected visualization type, and the labels). The database stores information of these dashboards and isolate them as per users. To store such information and utilize the data efficiently, MongoDB is used in the form of docker container.
Tools and Frameworks used for developing this system:
- Flask framework (for backend operations and handling requests)
- ReactJS framework (for frontend user interface to interact with the system)
- Docker (for deployment)
- Plotly (for visualizations)
- MongoDB (for storing dashboard and blocks data)
For running the system on the local machine, clone the repository and make sure that node.js and python are installed. Another way is to have docker installed, since its much easier way to get the system up and running. Once the repository is cloned. Run npm install command in the frontend directory and create virtual environment in backend directory, followed by pip install requiremets.txt. This will install dependencies for both frontend and backend of the system. The final step includes running node and flask servers with commands npm start and flask run in respective directories. When running using manual commands, please ensure that the proxy specified in the package.json file in the frontend directory is set to "http://localhost:5000".
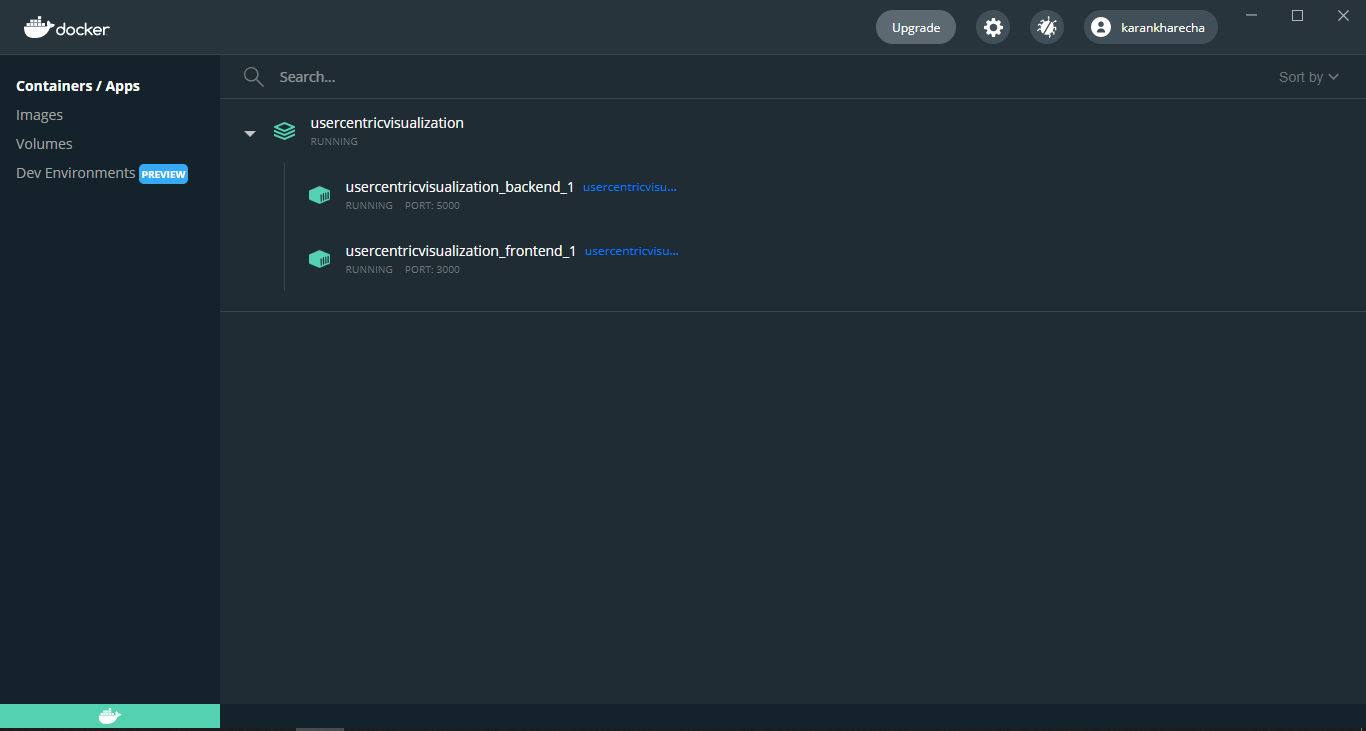
In case of running this system using docker, simply refer to the docker-compose.yml file and in the project root directory execute docker compose up command. Here, please ensure that the proxy specified in the package.json file in the frontend directory is set to "http://backend:5000".