This repository links to the paper and replication data and programs for my publication:
Grono, E. and Donovan, E.: Surveying pulsating auroras, Ann. Geophys., 38, 1–8, https://doi.org/10.5194/angeo-38-1-2020, 2020.
The supplemental data is available at:
Grono, Eric, 2019, "Replication data for: Surveying Pulsating Auroras", https://doi.org/10.5683/SP2/MICSLT, Scholars Portal Dataverse, V2
This study surveyed 280 days of ground-based camera data spanning 10 years to determine the probability of occurrence for three types of pulsating aurora. I developed a tool for manually identifying the start and end times as well as latitudinal boundaries of different types of pulsating aurora events. These boundaries allowed me to estimate the location of the source regions of these auroras using a model of Earth's magnetosphere. The key figures of this paper are included below to illustrate this process.
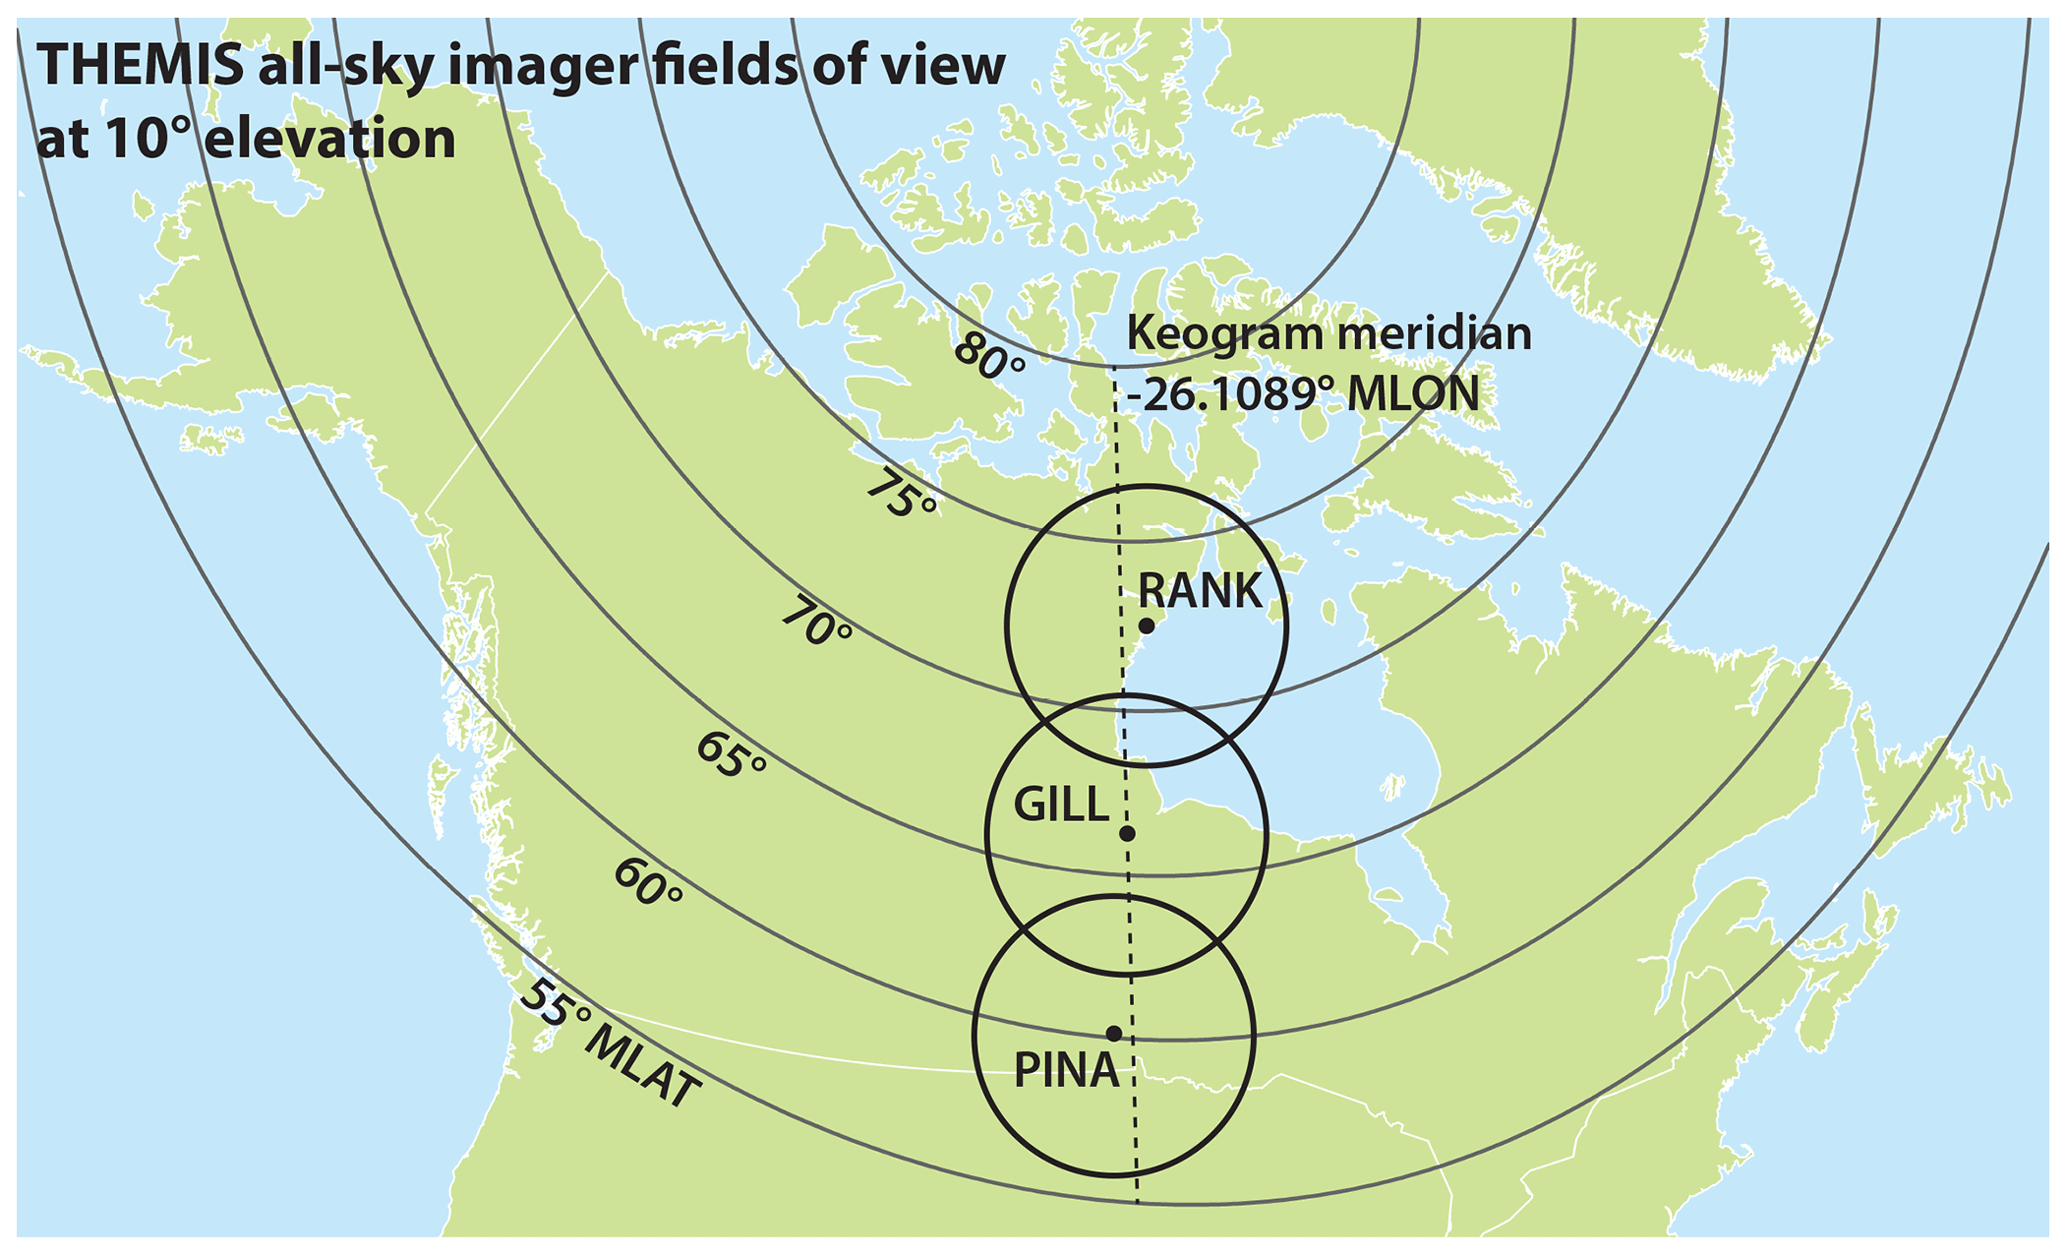
 Figure 2: An example of a keogram used to approximately define pulsating aurora occurrence. The regions where amorphous pulsating auroras (APAs, red), patchy pulsating auroras (PPAs, blue), and patchy auroras (PAs, yellow) can be identified in the keogram are marked with rectangles. The meridian that the keograms are aligned along is illustrated in Fig. 1.
 Figure 4: Occurrence probability of pulsating auroras based on a survey of times when Rankin Inlet, Gillam, and Pinawa THEMIS ASI had good visibility between 2006 through 2016. White bins in panels (a), (b), and (c) have data coverage but no events, corresponding to a 0 % occurrence probability. Panel (d) shows the number of days of data that had clear visibility in each MLT bin and coverage is uniform across the MLAT bins.
 Figure 6: Pulsating aurora occurrence mapped to the equatorial plane. Pulsating aurora time and latitude boundaries were mapped using the T89 model (Tsyganenko, 1989) given Kp and the solar wind velocity GSE X component. This figure is based on the same set of events as shown in Fig. 4, excluding those with poor solar wind data.