Parser and plotter for NEXRAD VAD retrievals.
The script downloads the VAD data from the NEXRAD Radar Product Dissemination page, parses the binary file, and plots the VAD retrieval as a hodograph. It also computes and displays some parameters of interest.
NumPy and Matplotlib are the only requirements to run this script.
python vad.py RADAR_ID [ -m STORM_MOTION ] [ -s SFC_WIND ] [ -t TIME ] [ -f IMG_NAME ]
                       [ -p LOCAL_PATH ] [ -c CACHE_PATH ]
RADAR_IDis a 4-character radar identifier (e.g. KTLX or KFWS). TDWRs (e.g. TDFW or TORD) also work.STORM_MOTIONis the storm motion vector. It can take one of two form. The first is eitherBRMfor the Bunkers right-mover vector orBLMfor the Bunkers left-mover vector. The second form isDDD/SS, whereDDDis the direction the storm is coming from in degrees, andSSis the storm speed in knots. An example might be 240/35 (from the WSW at 35 kts). If the argument is not specified, the default is to use the Bunkers right-mover vector.SFC_WINDis the surface wind vector. Its form is the same as theDDD/SSform of the storm motion vector. A dashed red line will be drawn on the hodograph from the lowest point in the VWP to the surface wind to indicate the approximate wind profile in that layer.TIMEis the plot time. It takes the form[YYYY-mm-]dd/HHMM, whereYYYYis the 4-digit year,mmis the month,ddis the day,HHis the hour, andMMis the minute. The year and month are optional. The script will plot the most recent VWP as of this time.IMG_NAMEis the name of the image the script produces. If not given, it defaults to<RADAR_ID>_vad.png. If you would like a vector image rather than a raster image, give a name with a .pdf file extension.LOCAL_PATHspecifies that, instead of downloading VWP data from the Internet, the script should load the VWP data from this path on the local disk. Data are assumed to have been downloaded from NCDC's NEXRAD archive. The name of the file should not be given; the script will construct the file name using the other information.CACHE_PATHis the path to a local directory in which to cache files downloaded from the Internet. The downloaded files can be read in directly using the -p option.
An example of the output is given below. See the interpretation section for more information.
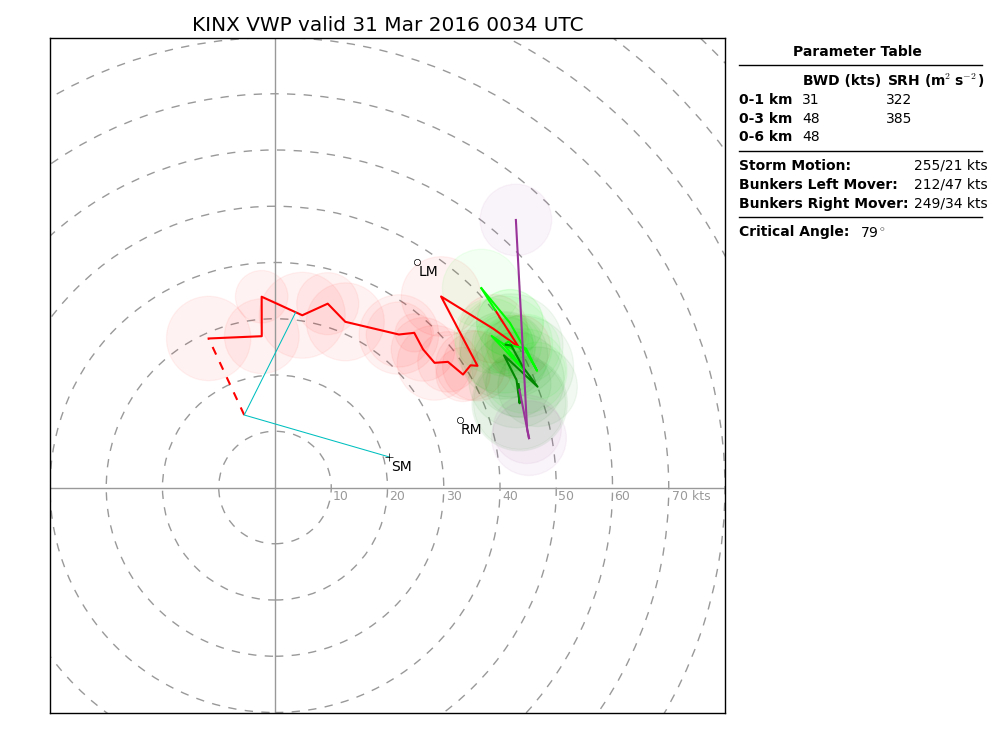
A "hodograph" is a graph of wind as a function of height. The u component of the wind is on the x axis and the v component of wind is on the y axis. Area on the hodograph is proportional to helicity, an important parameter in severe convective storm forecasting.
The colors denote different height layers, and follow the Storm Prediction Center's convention for their hodographs: red denotes the 0-3 km layer, light green denotes the 3-6 km layer, dark green denotes the 6-9 km layer, purple denotes the 9-12 km layer, and cyan denotes the layer from 12 km on up. The colored circles are proportional in radius to the RMS error in the VAD retrieval at each level.
When computing the parameters, in the absence of a specified surface wind, the "surface" is taken to be the lowest data point in the VWP, which is often ~100 m AGL.