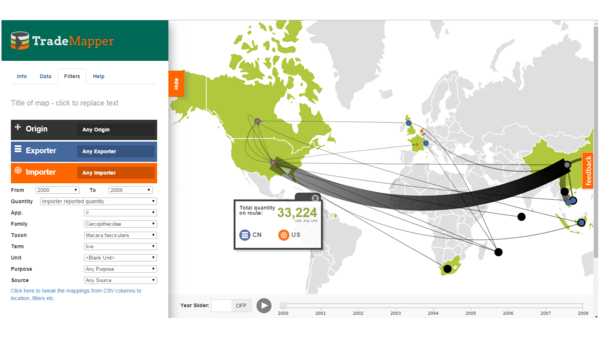
Javascript application and libraries for mapping international trade using d3.js It runs in the browser, and you can import data from CSV files, view the trade on the map, filter by various columns, and zoom and pan around the resulting map.
The illegal trade in wildlife threatens some of our planet’s most iconic species such as rhinos, tigers and elephants, and evolves rapidly; taking advantage of new routes and other opportunities to avoid detection. To understand and manage the ever-changing trade effectively, scientists and conservationists need to work with large volumes of data that describe international movement of wildlife and wildlife products (like ivory and rhino horn). This helps them understand the spatial patterns of trade, and determine what factors are influencing it and how these can be addressed. These findings then need to be communicated clearly and effectively with decision-makers and the public. Only then can solutions be found, and wildlife protected.
To help, we built TradeMapper: an open source interactive browser-based tool that maps international wildlife trade flow data, allowing users to visualise the global trade in wildlife. TradeMapper offers a way to explore trends, both historical and geographical, in a way that is simply impossible when dealing with dry numerical data in a spreadsheet.
But ultimately, TradeMapper is not limited to wildlife data - it can map international trade of any variety.
Join our google group.
We have more detailed information on the wiki, including: