Note: this project has been archived, consider migrating to the more modern, production-grade https://github.com/swisscom/kubeone-dcs-kubernetes.
Your existing Kubernetes cluster deployments will of course continue working just fine with the last release (v2.6.0) of this repository here, but the new KubeOne design offers many advantages over it:
- Node autoscaling / dynamic worker VMs
- Multiple worker pools possible
- vCloud-CSI integration (no need for Longhorn and worker VMs with large disks)
- Newer Kubernetes versions, with an easier upgrade procedure
- Battle-tested KubeOne tooling for cluster management
- More resilient Helm chart deployments

Deploy a Kubernetes cluster on Swisscom DCS+
Check out the installation guide for requirements, configuration and how to deploy a cluster.
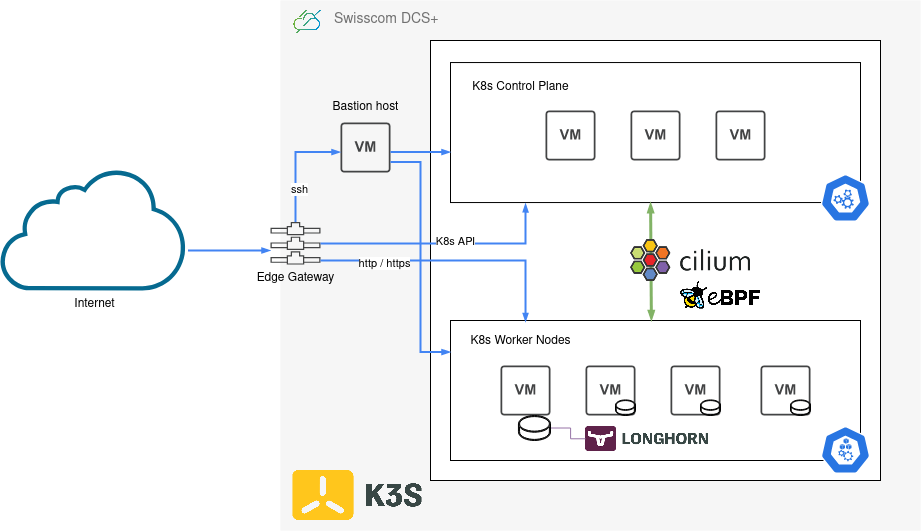
This Terraform module supports you in creating a Kubernetes cluster with K3s on Swisscom DCS+ infrastructure. It also installs and manages additional deployments on the cluster, such as cilium, ingress-nginx, cert-manager, longhorn, and a whole set of logging/metrics/monitoring related components. It consists of three different submodules, infrastructure, kubernetes and deployments. Each of these is responsible for a specific subset of features provided by the overall Terraform module.
The infrastructure module will provision resources on DCS+ and setup a private internal network (10.80.0.0/24 CIDR by default), attach an Edge Gateway with an external public IP and configure loadbalancing services, deploy a bastion host (jumphost) for external SSH access into the private network, and finally a set of Kubernetes control plane and worker nodes for hosting your workload.
The kubernetes module will then connect via SSH over the bastion host to all those control plane and worker nodes and install a K3s Kubernetes cluster on them.
Finally the deployments module is responsible for installing system components and software on to the Kubernetes cluster. It does most of its work through the official Helm charts of each component, plus some additional customization directly via kubectl / manifests.
The final result is a fully functioning, highly available Kubernetes cluster, complete with all the batteries included you need to get you started. Ingress Controller for HTTP virtual hosting / routing, TLS certificate management with automatic Let's Encrypt certificates for all your HTTPS traffic, PersistentVolume and storage management with optional backups, and an entire monitoring stack for metrics and logs.
| Component | Type | Description |
|---|---|---|
| Cilium | Networking | An open-source, cloud native and eBPF-based Kubernetes CNI that is providing, securing and observing network connectivity between container workloads |
| Longhorn | Storage | Highly available persistent storage for Kubernetes, provides cloud-native block storage with backup functionality |
| Ingress NGINX | Routing | Provides HTTP traffic routing, load balancing, SSL termination and name-based virtual hosting |
| Cert Manager | Certificates | Cloud-native, automated TLS certificate management and Let's Encrypt integration for Kubernetes |
| Kubernetes Dashboard | Dashboard | A general purpose, web-based UI for Kubernetes clusters that allows users to manage and troubleshoot applications on the cluster, as well as manage the cluster itself |
| Prometheus | Metrics | An open-source systems monitoring and alerting platform, collects and stores metrics in a time series database |
| Loki | Logs | A horizontally scalable, highly available log aggregation and storage system |
| Promtail | Logs | An agent which collects and ships the contents of logs on Kubernetes into the Loki log storage |
| Grafana | Dashboard | Allows you to query, visualize, alert on and understand all of your Kubernetes metrics and logs |
| Kured | System | A daemonset that performs safe automatic node reboots when needed by the package management system of the underlying OS |
Please refer to our installation documentation for detailed information about:
- System requirements
- Terraform configuration
- Cluster provisioning
After the initial installation or upgrade with terraform apply has finished, you should see a couple of output parameters in your terminal:
Outputs:

cluster_info = "export KUBECONFIG=kubeconfig; kubectl cluster-info; kubectl get pods -A"
grafana_admin_password = "export KUBECONFIG=kubeconfig; kubectl -n grafana get secret grafana -o jsonpath='{.data.admin-password}' | base64 -d; echo"
grafana_url = "https://grafana.my-kubernetes.my-domain.com"
kubernetes_dashboard_token = "export KUBECONFIG=kubeconfig; kubectl -n kubernetes-dashboard create token kubernetes-dashboard"
kubernetes_dashboard_url = "https://dashboard.my-kubernetes.my-domain.com"
loadbalancer_ip = "147.5.206.133"
longhorn_dashboard = "export KUBECONFIG=kubeconfig; kubectl -n longhorn-system port-forward service/longhorn-frontend 9999:80"
These give you a starting point and some example commands you can run to access and use your newly provisioned Kubernetes cluster.
There should be a kubeconfig file written to the Terraform module working directory. This file contains the configuration and credentials to access and manage your Kubernetes cluster. You can set the environment variable KUBECONFIG to this file to have your kubectl CLI use it for the remainder of your terminal session.
$ export KUBECONFIG=$(pwd)/kubeconfigNow you can run any kubectl commands you want to manage your cluster, for example:
$ kubectl cluster-info
Kubernetes control plane is running at https://147.5.206.133:6443
CoreDNS is running at https://147.5.206.133:6443/api/v1/namespaces/kube-system/services/kube-dns:dns/proxy
Metrics-server is running at https://147.5.206.133:6443/api/v1/namespaces/kube-system/services/https:metrics-server:https/proxy

$ kubectl get nodes -o wide
NAME           STATUS   ROLES                       AGE   VERSION        INTERNAL-IP   EXTERNAL-IP   OS-IMAGE             KERNEL-VERSION      CONTAINER-RUNTIME
k8s-server-0   Ready    control-plane,etcd,master   40h   v1.24.3+k3s1   10.80.0.50    <none>        Ubuntu 22.04.1 LTS   5.15.0-46-generic   containerd://1.6.6-k3s1
k8s-server-1   Ready    control-plane,etcd,master   40h   v1.24.3+k3s1   10.80.0.51    <none>        Ubuntu 22.04.1 LTS   5.15.0-46-generic   containerd://1.6.6-k3s1
k8s-server-2   Ready    control-plane,etcd,master   40h   v1.24.3+k3s1   10.80.0.52    <none>        Ubuntu 22.04.1 LTS   5.15.0-46-generic   containerd://1.6.6-k3s1
k8s-worker-0   Ready    <none>                      39h   v1.24.3+k3s1   10.80.0.100   <none>        Ubuntu 22.04.1 LTS   5.15.0-46-generic   containerd://1.6.6-k3s1
k8s-worker-1   Ready    <none>                      39h   v1.24.3+k3s1   10.80.0.101   <none>        Ubuntu 22.04.1 LTS   5.15.0-46-generic   containerd://1.6.6-k3s1
k8s-worker-2   Ready    <none>                      39h   v1.24.3+k3s1   10.80.0.102   <none>        Ubuntu 22.04.1 LTS   5.15.0-46-generic   containerd://1.6.6-k3s1

$ kubectl get namespaces
NAME                   STATUS   AGE
cert-manager           Active   39h
default                Active   40h
grafana                Active   37h
ingress-nginx          Active   39h
kube-node-lease        Active   40h
kube-public            Active   40h
kube-system            Active   40h
kubernetes-dashboard   Active   39h
loki                   Active   36h
longhorn-system        Active   39h
prometheus             Active   37h
promtail               Active   36h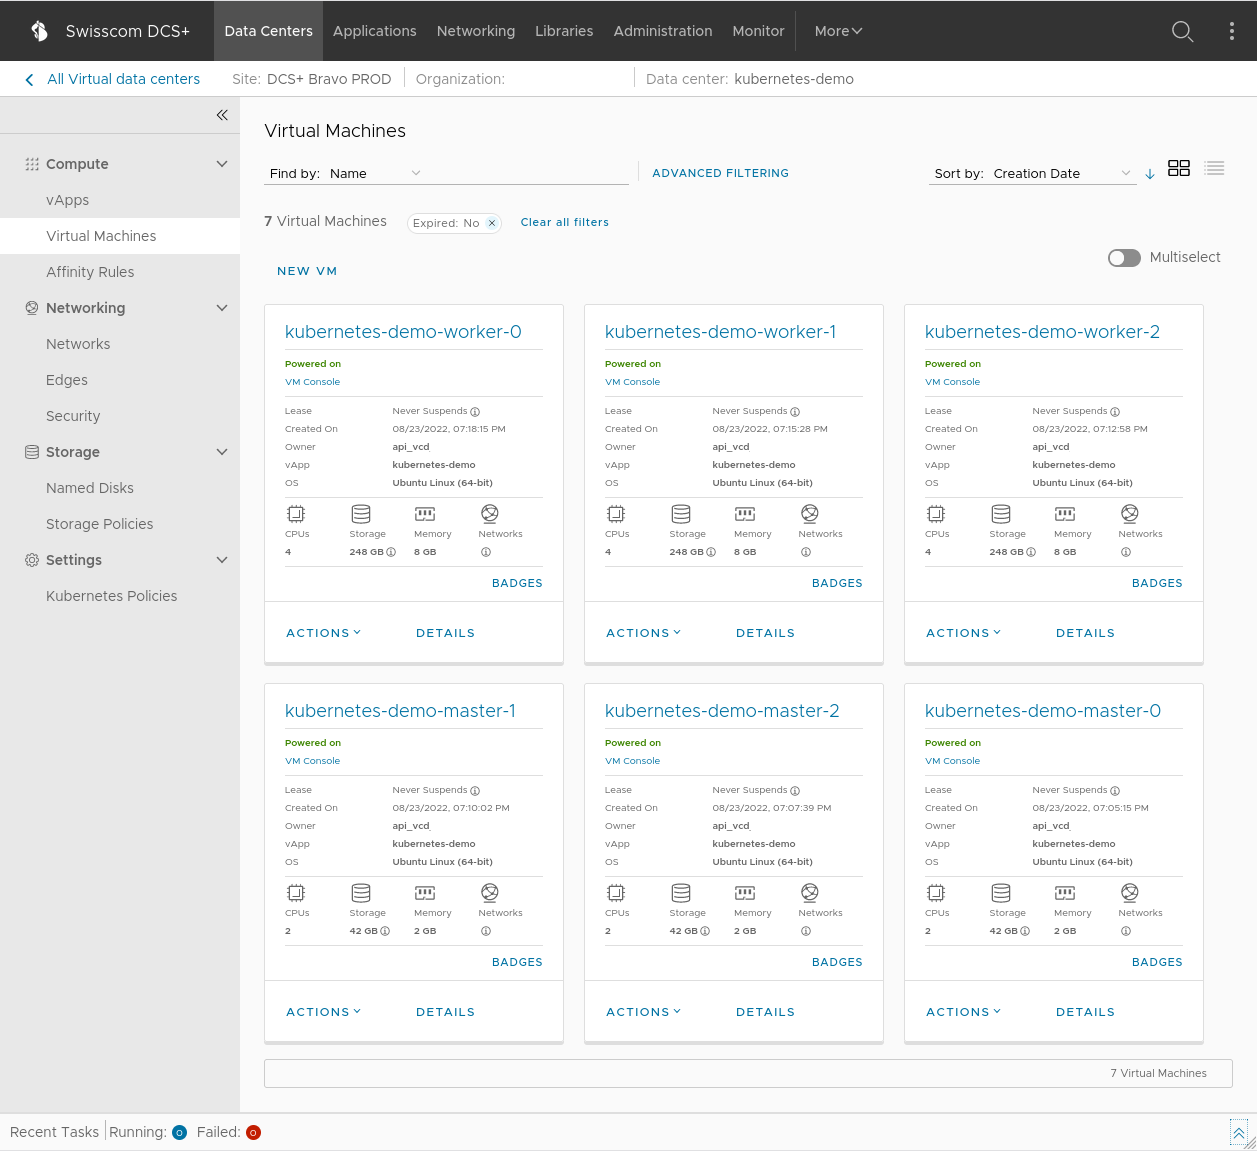
By default (unless configured otherwise in your terraform.tfvars) once the deployment is done you should see something similar to above in your DCS+ Portal. There will be 1 bastion host (a jumphost VM for SSH access to the other VMs), 3 control plane VMs for the Kubernetes server nodes, and 3 worker VMs that are responsible for running your Kubernetes workload.
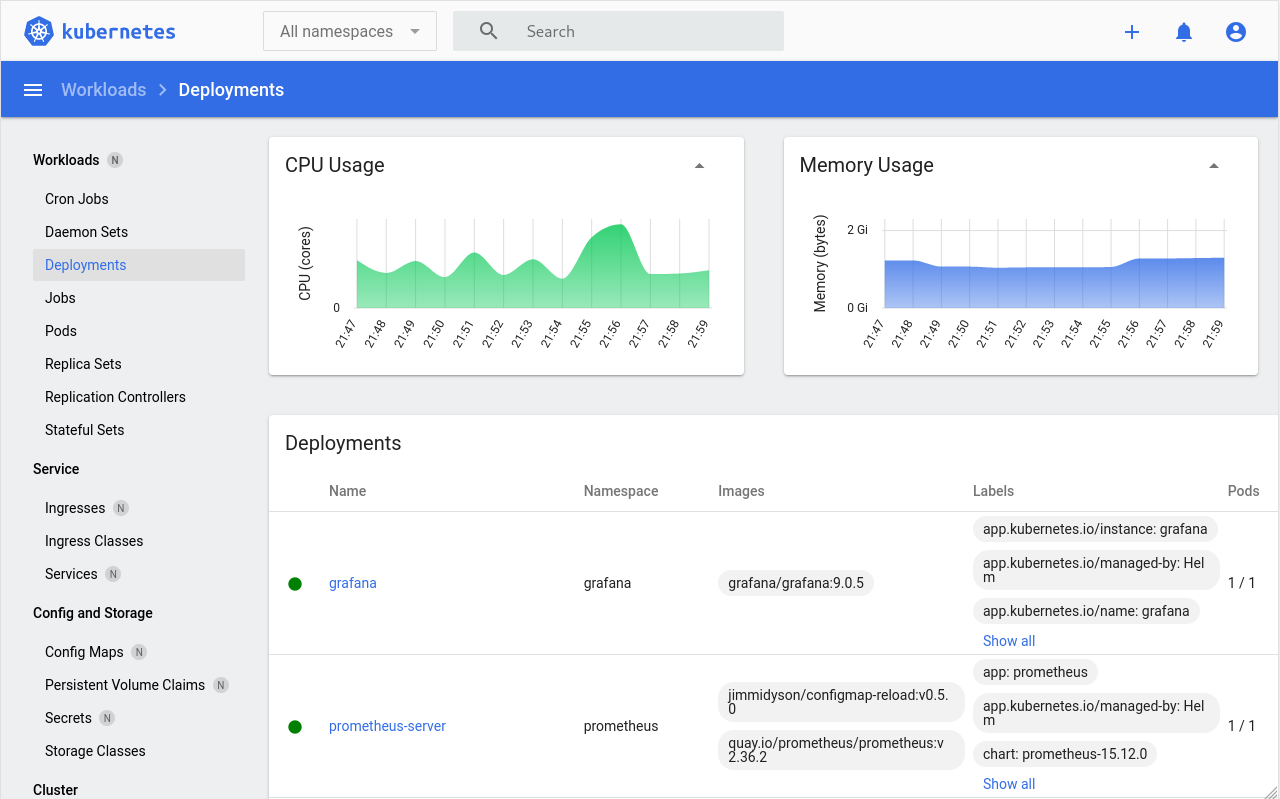
The Kubernetes dashboard will automatically be available to you after installation under https://dashboard.my-kubernetes.my-domain.com (with my-kubernetes.my-domain.com being the value you configured in terraform.tfvars -> k8s_domain_name)
In order to login you will first need to request a temporary access token from your Kubernetes cluster:
$ kubectl -n kubernetes-dashboard create token kubernetes-dashboardWith this token you will be able to sign in into the dashboard.
Note: This token is only valid temporarily, you will need request a new one each time it has expired.
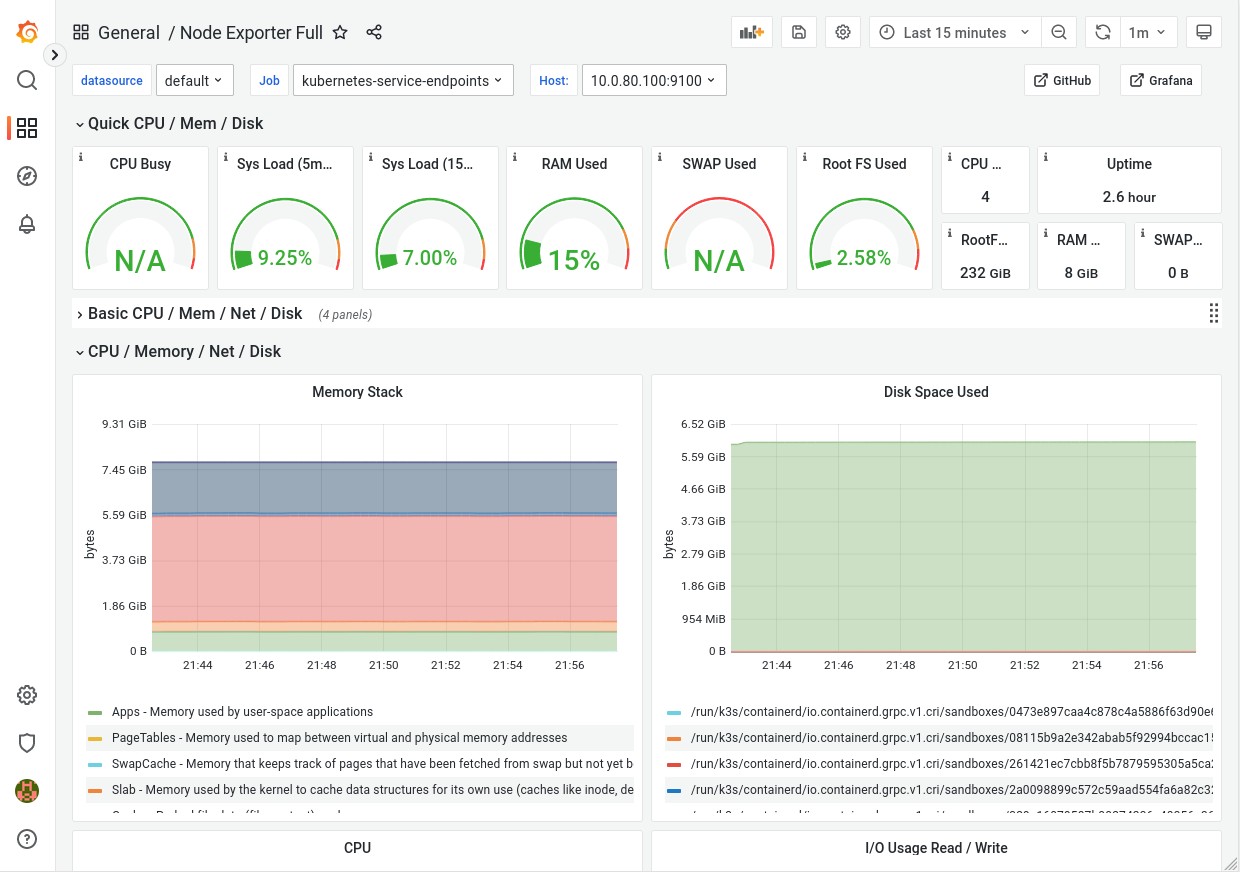
The Grafana dashboard will automatically be available to you after installation under https://grafana.my-kubernetes.my-domain.com (with my-kubernetes.my-domain.com being the value you configured in terraform.tfvars -> k8s_domain_name)
The username for accessing Grafana will be admin and the password can be retrieved from Kubernetes by running:
$ kubectl -n grafana get secret grafana -o jsonpath='{.data.admin-password}' | base64 -d; echo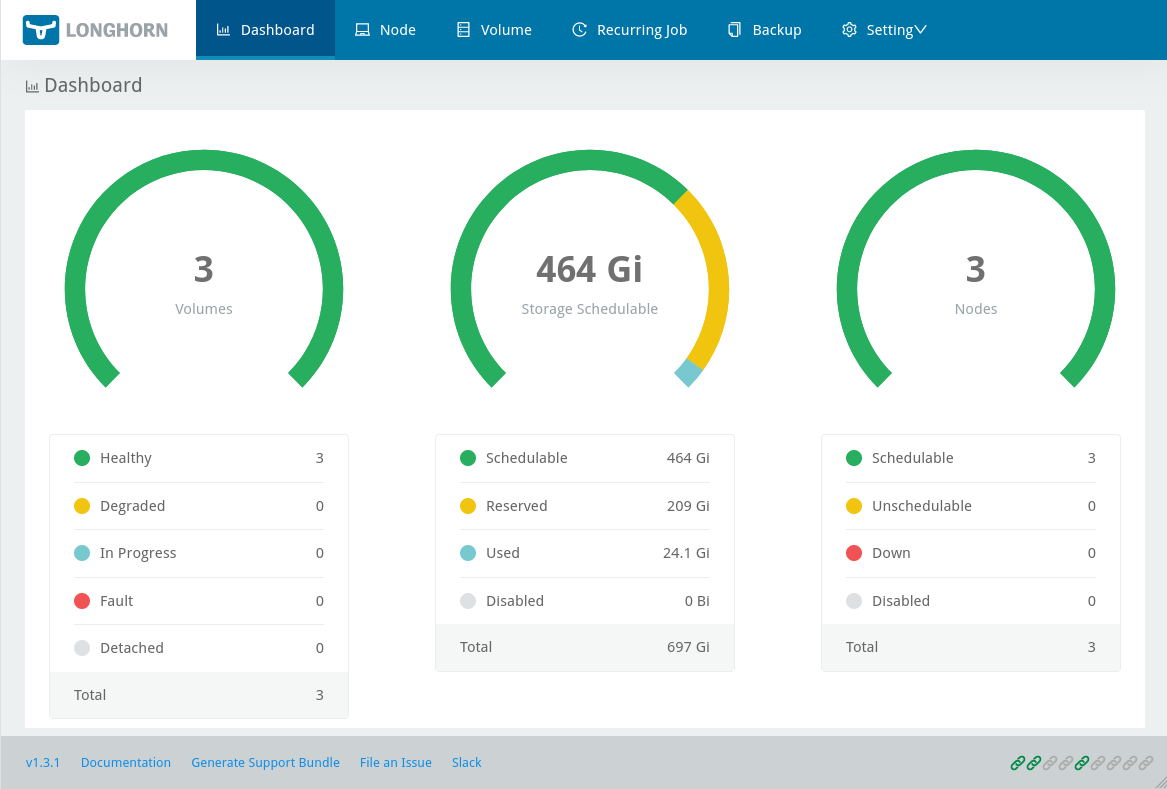
To access the Longhorn dashboard you have to initialize a localhost port-forwarding towards the service on the cluster, since it is not exposed externally:
$ kubectl -n longhorn-system port-forward service/longhorn-frontend 9999:80This will setup a port-forwarding for localhost:9999 on your machine. Now you can open the Longhorn dashboard in your browser by going to http://localhost:9999/#/dashboard.
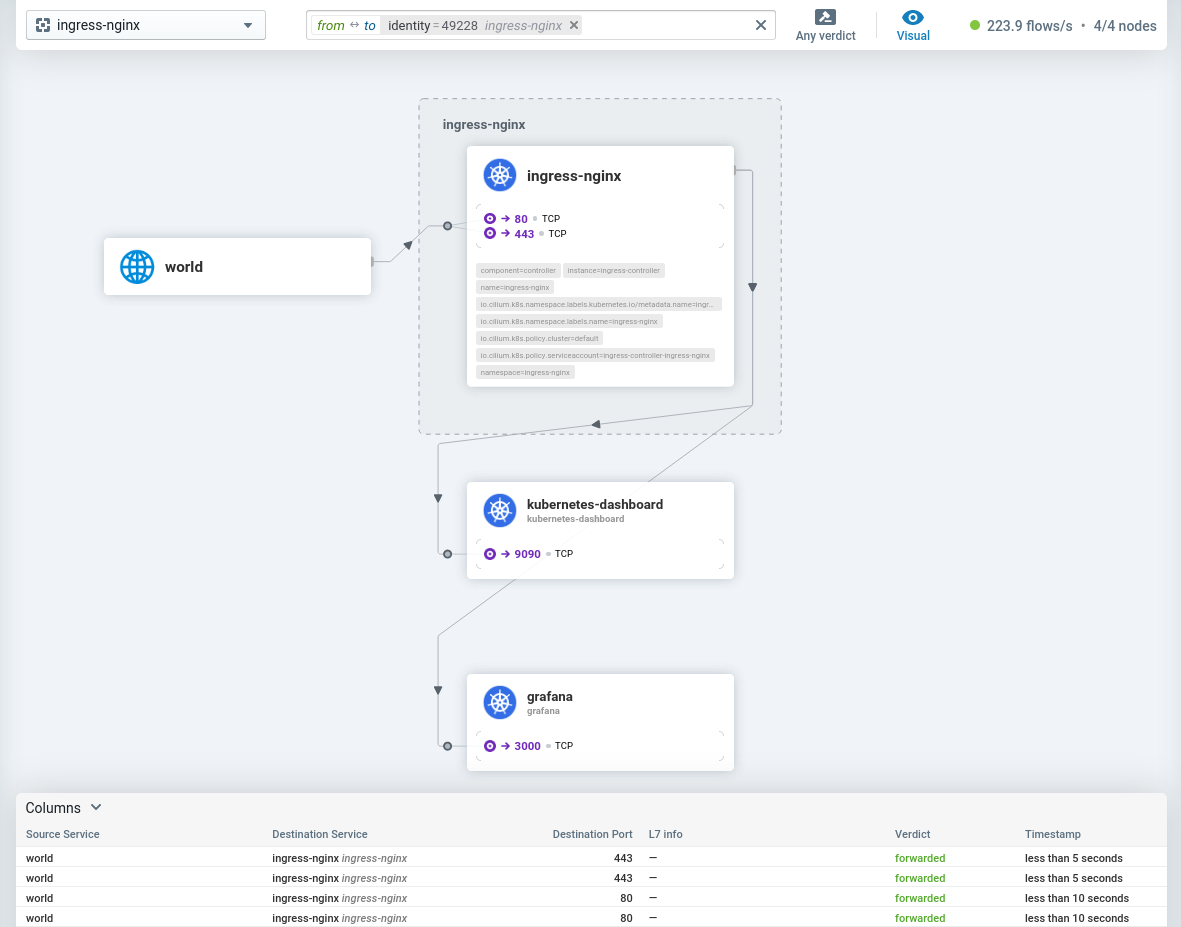
The easiest way to access the Cilium Hubble UI is to download and install the Cilium CLI, and then simply run the following command:
$ cilium hubble uiThis will setup a port-forwarding in the background and open up a browser, pointing to the Hubble UI at http://localhost:12000.