Check this other SEO project in production --> http://keywordresearchtool.io/
This is an ETL project that is focused on having a complete SEO dashboard for reporting purposes. This is the first version of this project and only includes basic data from Google. I'm working on including more metrics like Backlink profiles, Daily rankings for specific keywords, Search volumes and more.
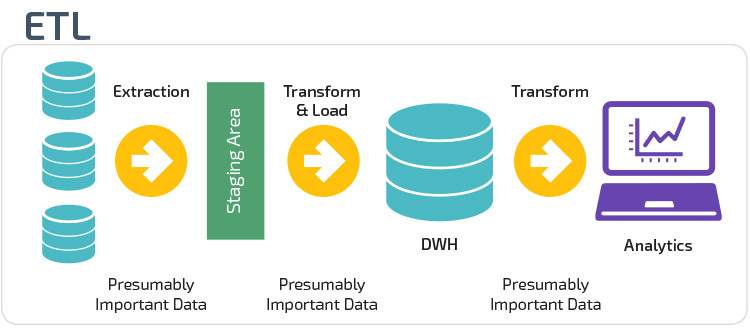
The task for this project is to create an ETL pipeline using Google search organic traffic and load the data in a user-friendly dashboard. Our ETL process performs data cleaning during the extraction process and loads significant data into a data warehouse. Our main goal for this project is by having this pipeline we will be able to have the data in one place and make it easier for businesses stakeholders to access this data, analyze it and discover different business insights.
We will be working with Monthly Google search organic traffic from the domain https://www.tuves.cl. This data will be acquired by using the Google search API. We will use 9 different data sets of search traffic and they are the following:
- Mobile, Desktop and Tablet - Day to day Organic data: These are multiples CSV files that are organized by date and includes Keywords, Clicks, Impressions, CTR, Ranking, Device and Date.
- Mobile, Desktop and Tablet - Monthly Top 10 Keywords: One data set that includes Keyword, Clicks, Impressions, Avg CTR and Avg Ranking for the specific device and time frame.
- Mobile, Desktop and Tablet - Monthly Top 10 URLs: One data set that includes URL, Clicks, Impressions, Avg CTR and Avg Ranking for the specific device and time frame.
This project is composed by 5 steps.
-
Extraction: Extract the Google search data using the Google search API. Our data will be saved in CSV files. This is folder 0Google Top Kws&urls and 1Google API Day to day. We are using the Google search console and a python script to perform this step.
-
Transform: Transform the day to day data into 3 monthly data sets. A mobile data set, a desktop and a tablet. The Keywords and URLs are ready to go. This is in folder 2data-cleaning. We are cleaning the data with a python script I created.
-
Load: Load the data to the data warehouse. We will be using a MySQL database. This is in folder 3data-to-sql. We are loading our data to MySQL using a python script I created.
-
Load: Build a REST API that will parse all of our MySQL tables into JSON. This is in folder 4RESTapi. We are using NodeJS and ExpressJS to build our restful API.
-
Analyze: Create a dashboard where we will load our data and analyze it using tables and visualizations. This is in folder dashboard. Reactjs, ChartJS, Axios, and Reactstrap.

You can find detailed information here --> Full report