This dasboard application based on the sepal-ui framework, provide the user with a friendly interface to use the GPU implementation of the bfast algorithm.
The bfast package provides an efficient massively-parallel implementation for one of the state-of-the-art change detection methods called Breaks For Additive Season and Trend (BFASTmonitor) proposed by Verbesselt et al.
The scripts provide the following tvrt outputs:
- ~/module_results/bfast/[name_of_input]/[bfast_params]/bfast_outputs.vrt
It is a 2 band raster with band 1 being the breakpoints in decimal year format and on band 2, the magnitude of change. This raster has the exact same dimension as the input raster
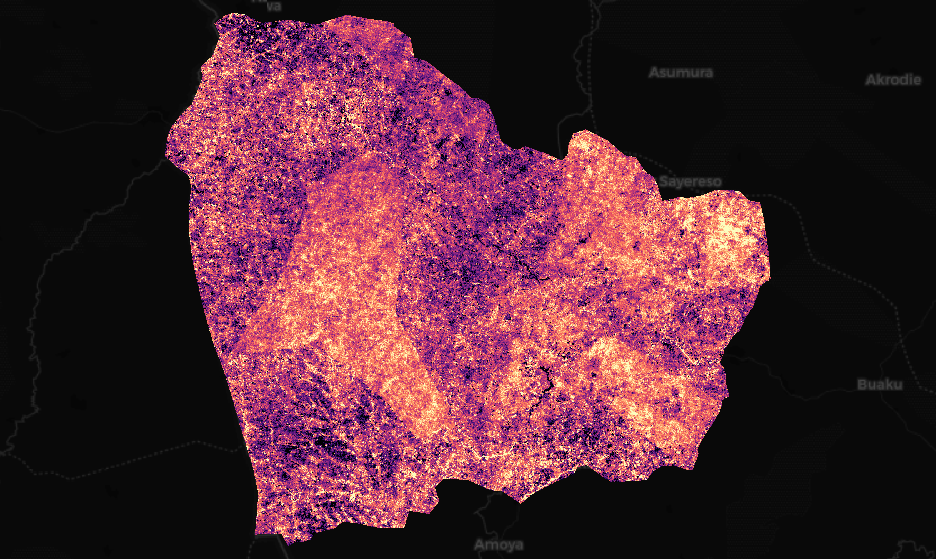
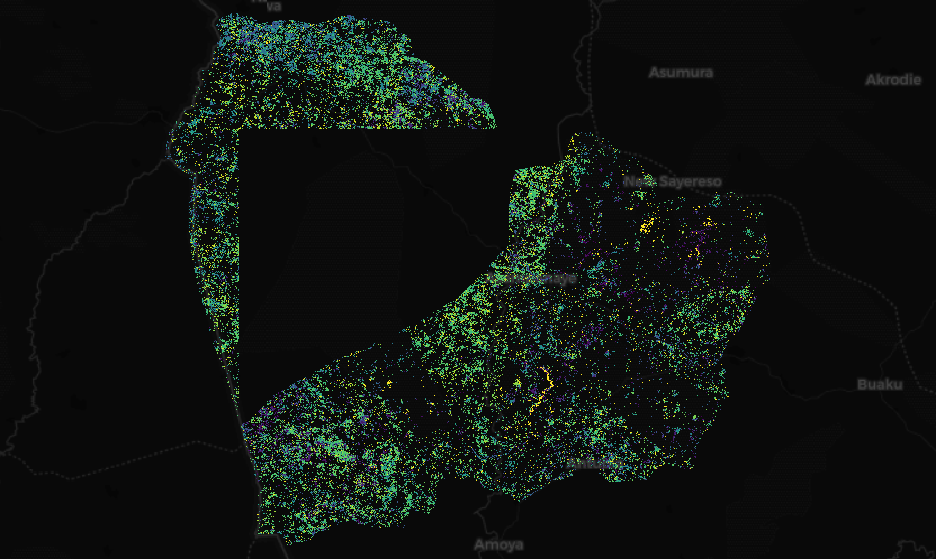
Here you'll find an example of this 2 bands over the Juaboso Region in Ghana whit a monitoring period between 2017 and 2019:
 |
 |
|---|---|
| Magnitude display with the magma colormap, values in [-624, 417] | Breaks masked in the center of the region. displayed with a viridis colormap, values in [2017.26, 2019.98] |
first download the repository to your own sepal account
git clone https://github.com/12rambau/bfast_gpu.git
Then in the bfast_gpu folder, launch the ui.ipynb notebook and run it with voila.
⚠️ If for some reason the sepal_ui module doesn't work on your instance, you can run theno_ui.ipynbfile as a notebook usingkernel->run all