This repository contains a set of scripts that setup a Linux virtual network with VPP routers running the Path Tracing protocol. Path Tracing is an open-source in-band telemetry protocol developed by Cisco which provides records of the packet's forwarding path as well as end-to-end delay, per-hop delay and load on each transit node interface. The main script also launches python programs that process and enrich telemetry packets to prepare them for visualization.
The information in the telemetry packets can be used to visualize important network metrics such as delay and paths. The pipeline is based on Apache Kafka, Apache Druid, and the Turnilo visualization platform. However it is also possible to spin up the virtual network alone, if desired.
For more details explanations on Path Tracing and how the pipeline works refer to My Master Thesis, which was carried out at ETH Zurich toghether with the Swisscom Network Telemetry and Analytics Team.
Instructions on how to install the required dependencies, docker containers and launch the virtual environment are available below.

-
We have deployed the pipeline on an Ubuntu 20.04 server, although it should work for any debian based distro. Additional required packages can be installed with the following commands:
sudo apt install net-tools bridge-utils python3-pip sudo snap install jo pip install confluent-kafka pip install pydruid -
VPP with Path Tracing Plugin
In order to install the VPP binaries refer to the README in the vpp folder. -
Each one of the 8 VPP instances is assigned to a single CPU core. We suggest assigning each VPP instance to a single core for stability reasons. You most likely will need to adjust the cpu main-core indexing in the setup script (pipeline/setup-network.sh) under "Start VPP instances" to reflect the available cores on your VM. For example, in a VM with 8 cores, the indexes range from 0 to 7. To assign the virst VPP instance to the first core the parameter in the setup script will be:
cpu {main-core 0} -
Going through the setup script you will find other parameters that you can change, such as for example link_delays and Path Tracing templates.
The following requirements need to be satisfied if you wish to deploy the Data Collection and Visualization pipeline as well. They are not needed if you only want to setup the virtual network to try out Path Tracing without the visualization pipeline:
-
Apache Kafka Message Broker and Apache Druid Time Series Database
Kafka and Druid can be deployed as docker containers. A docker-compose.yml file, information on how to provision it as well as configuration files are available in the docker folder. -
Turnilo visualization backend
Instruction on how to install and configure Turnilo are available in the turnilo folder. -
Pmacct collector
Pmacct needs to be installed if IPFIX integration is desired, but is not required for basic functionality of the main Path Tracing pipeline. Refer to the "Design" section of my thesis for more explanations. The nfacct daemon (Pmacct daemon listening for IPFIX packets) can be deployed as a docker container. A docker-compose.yml file, instructions on how to provision it as well as configuration files are available in the docker folder.
-
Make sure all the requirements are satisfied
-
Navigate to the pipeline directory
cd path_tracing/pipeline -
Run this script to setup the virtual network and launch the visualization pipeline scripts
./setup-network.sh -
(Alternative) Setup the virtual network only (writing JSON metrics to probing_bins/collector.log file instead of kafka)
./setup-network.sh --no-visual
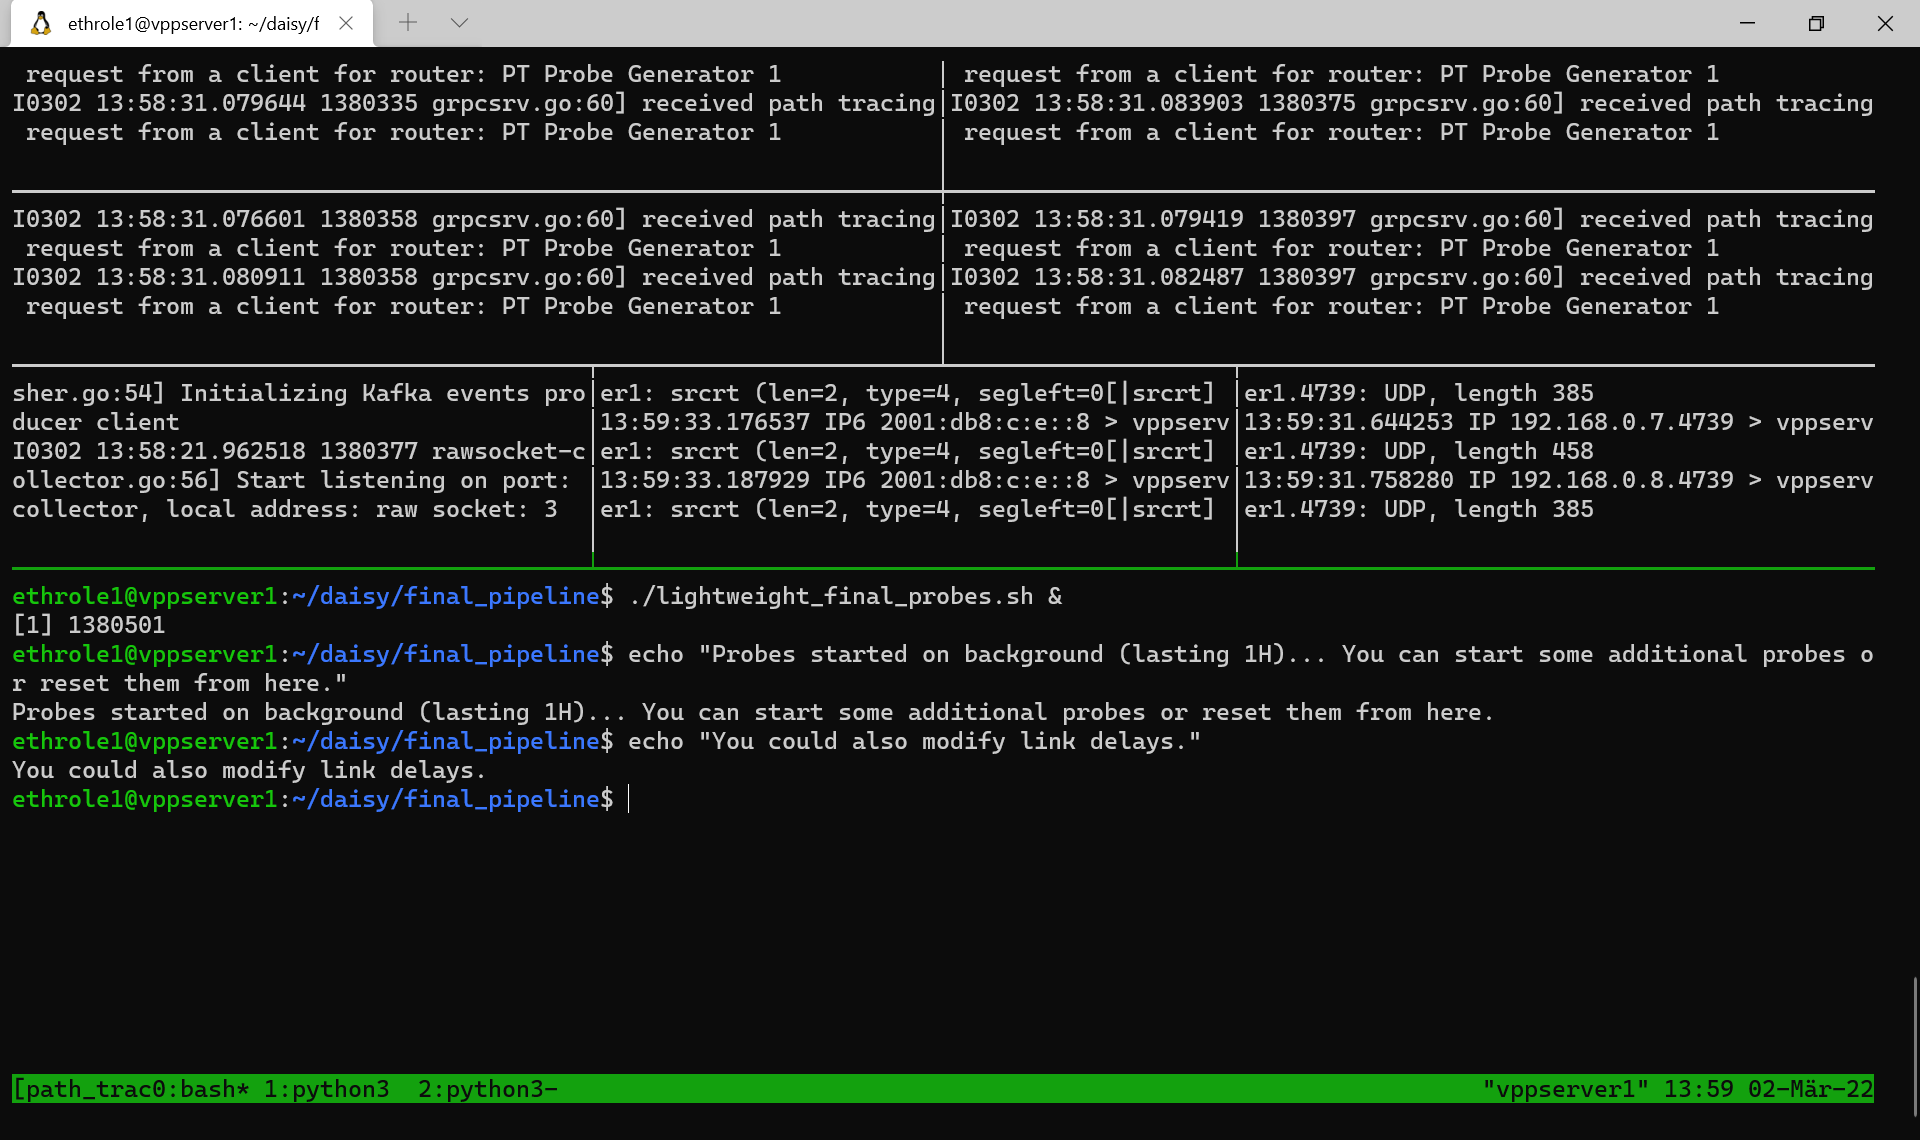
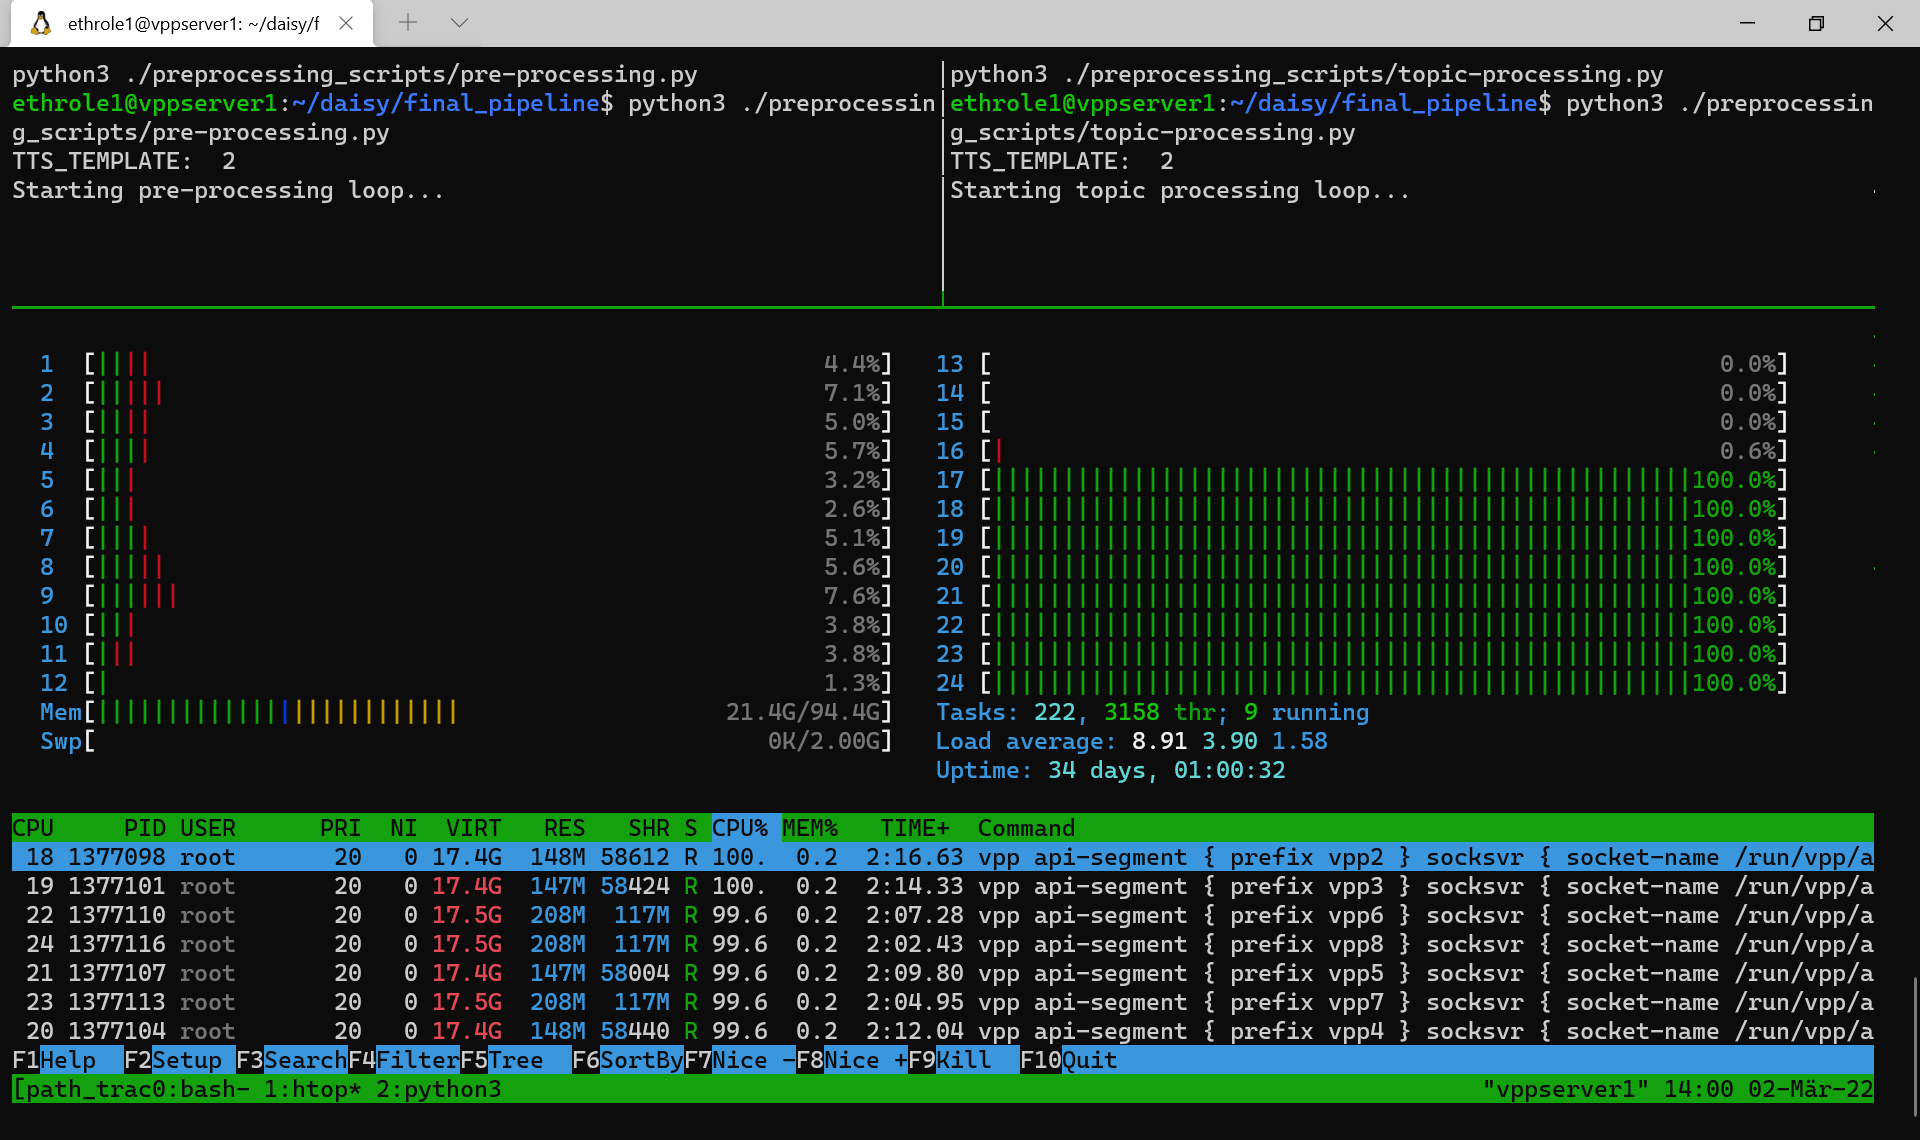
The script takes care of bootstrapping the virtual network, starting some python processing programs and launches Path Tracing probes sessions to generate traffic into the network. If successful, the script will launch a tmux session with debugging info:
| Window 1 | Window 2 |
|---|---|
 |
 |
From the tmux session, it is possible to trigger the following functionality:
-
Stop current probing session:
./reset_probing.sh -
Start the default probing sessions:
./lightweight_final_probes.sh -
Start probing sessions with more bandwidth:
./final_probes.sh -
Start additional probing sessions
Refer to final_probes.sh scripts for example syntax on how to interact with the Path Tracing probe generation binaries. -
Ping throughout the network to check connectivity (this is also done when the script boots up):
./reping_all.sh -
Change default link delays (a network diagram with default link delays available here)
  ./link_delay_set.sh --help                                      # help
  ./link_delay_set.sh --link <"link_id"> --delay <delay_ms>       # set new delay to link
  ./link_delay_set.sh --defaults                                  # reset to default values
- Turnilo listens at port localhost:9090
- Druid listens at port localhost:8888
Here some examples of possible visualization in Turnilo:


Additional visualization examples are available in the "Evaluation" section of my thesis.
The following commands stop all vpp instances, programs, scripts and removes all linux network interfaces.
-
Exit the tmux session ("ctrl+b" then "d"), then run:
./clean-network.sh