
A Python 3 module to convert matplotlib contour plots to geojson. Supports both contour and contourf plots.
Designed to show geographical contour plots, created with matplotlib/pyplot, as vector layer on interactive slippy maps like OpenLayers and Leaflet.
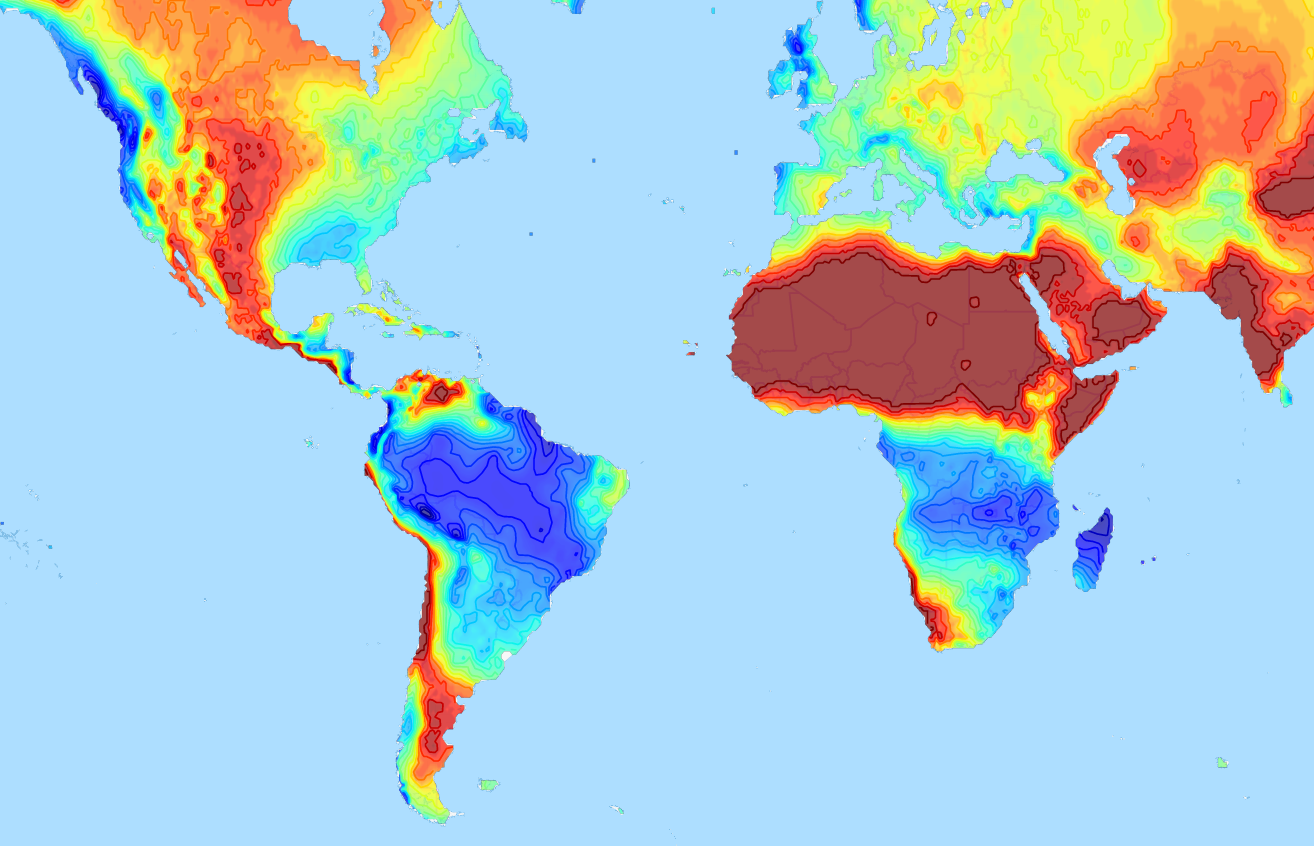
Demo project that uses geojsoncontour: climatemaps.romgens.com
This fork fixes issues with geojson style properties of the Leaflet/JS mapping library. The package converts matplotlib contour plots to geojson files, which can be used in e.g. Folium (Python wrapper for Leaflet) or within Leaflet directly. Here, particular emphasis is also given to a meaningful treatment of the time information of a transient/instationary/animated contour plot in order to make animated interactive leaflet visualizations possible. However, this tool does not yet provide functionality to build files containing multiple time steps.
Install with pip,
$ pip install geojsoncontour
$ pip install -e local_path_to_checkout/geojsoncontour
Use contour_to_geojson to create a geojson with contour lines from a matplotlib.contour plot (not filled).
Use contourf_to_geojson to create a geojson with filled contours from a matplotlib.contourf plot.
import numpy
import matplotlib.pyplot as plt
import geojsoncontour

# Create contour data lon_range, lat_range, Z
<your code here>

# Create a contour plot plot from grid (lat, lon) data
figure = plt.figure()
ax = figure.add_subplot(111)
contour = ax.contour(lon_range, lat_range, Z, cmap=plt.cm.jet)

# Convert matplotlib contour to geojson
geojson = geojsoncontour.contour_to_geojson(
    contour=contour,
    ndigits=3,
    unit='m'
)
For filled contour plots (matplotlib.contourf) use contourf_to_geojson.
See example_contour.py and example_contourf.py for simple but complete examples.
An easy way to show the generated geojson on a map is the online geojson renderer geojson.io.
Stroke color and width are set as geojson properties following https://github.com/mapbox/simplestyle-spec.
Try geojson-vt or tippecanoe if performance is an issue and you need to tile your geojson contours.
Run all tests,
python -m unittest discover