Add Boxplot feature #2562
Add Boxplot feature #2562
Conversation
|
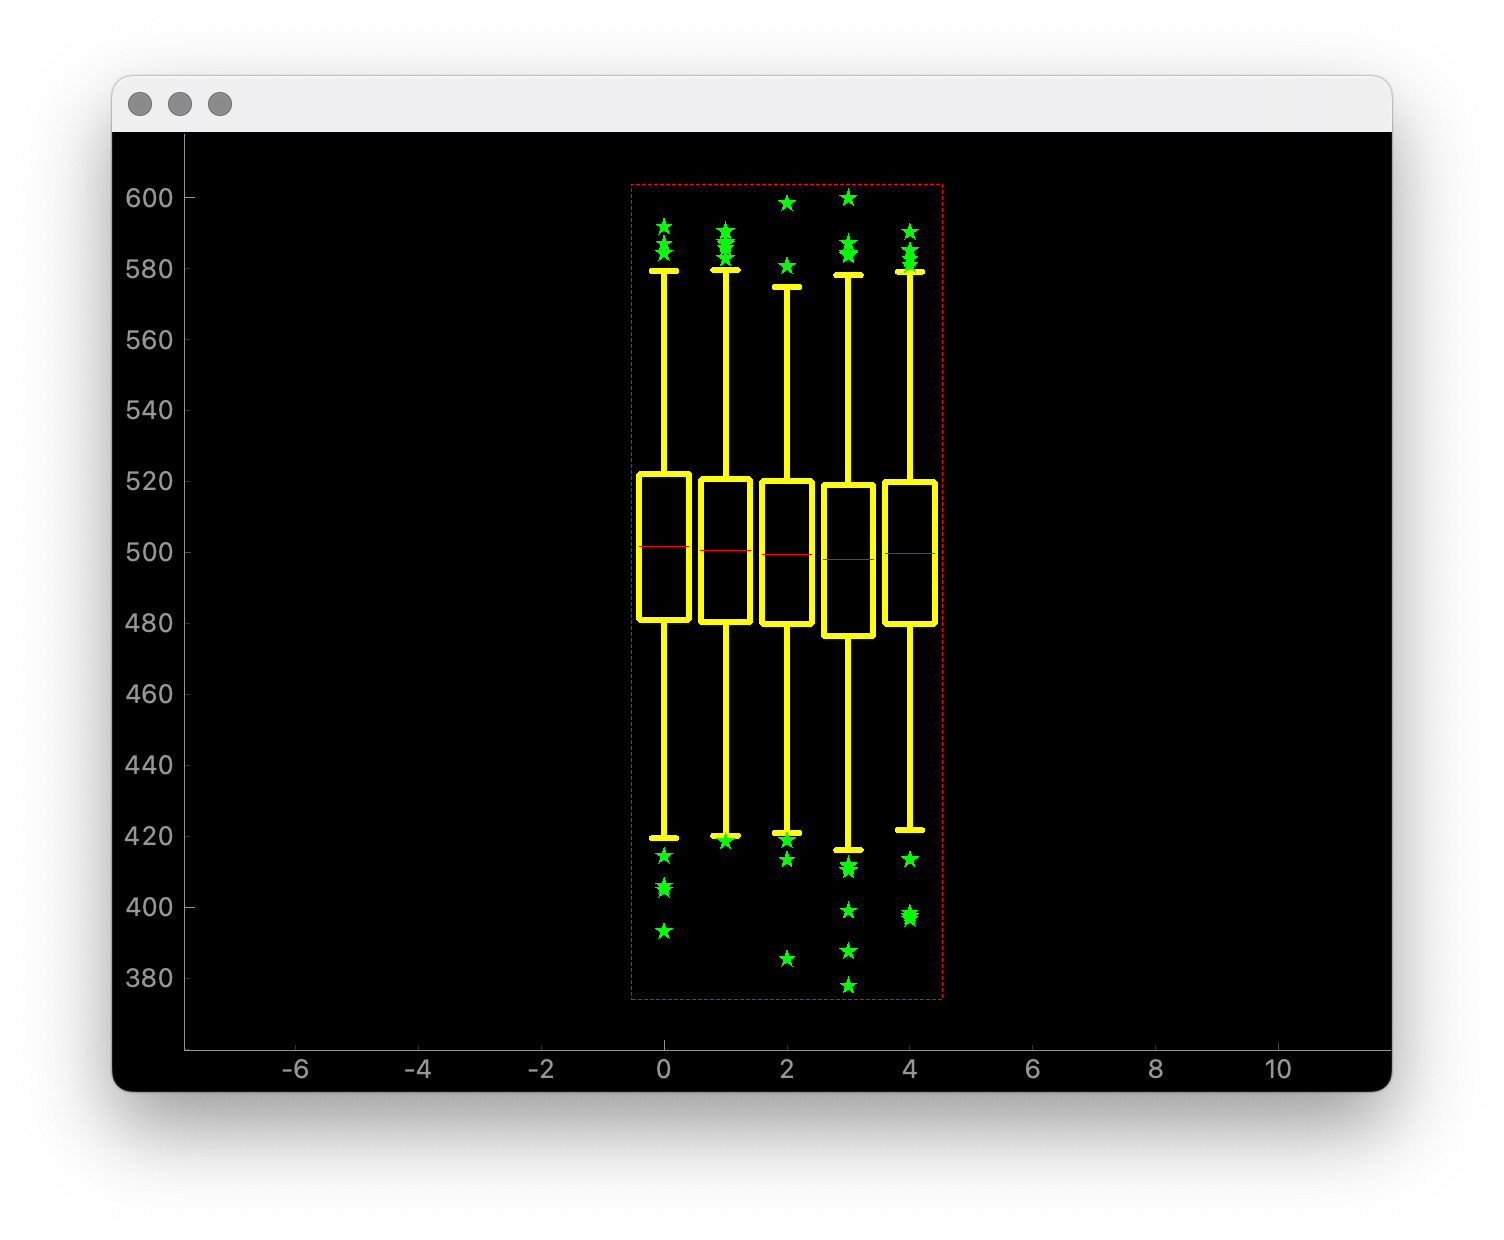
I think you left out From #2561, I found that getting the bounding rectangle right is not so straightforward. Below is a script that demonstrates two issues.
import numpy as np
import pyqtgraph as pg
from pyqtgraph.Qt import QtCore, QtGui, QtWidgets

class ObjectBounds(QtWidgets.QGraphicsItem):
    def paint(self, painter, *args):
        pen = QtGui.QPen(QtCore.Qt.GlobalColor.red, 0, QtCore.Qt.PenStyle.DashLine)
        rect = self.boundingRect()
        painter.setPen(pen)
        painter.drawRect(rect)
        print(rect)

    def boundingRect(self):
        return self.parentItem().boundingRect()

pg.mkQApp()
pw = pg.PlotWidget()
pw.show()

np.random.seed(8)
n = 5
data = [np.random.normal(500, 30, 1000) for _ in range(n)]

bpi = pg.BoxplotItem()
pen = pg.mkPen('y', width=6)
bpi.setData(data=data, pen=pen, symbol='star', symbolBrush='g')
pw.addItem(bpi)
rect = ObjectBounds(bpi)

pg.exec() |
|
@pijyoi Thanks for pointing out these issues, let me try to fix them. |
define __all__
|
@pijyoi bounding rect should be correct now.
|
|
I am getting the plot below on Windows/PyQt6 and also on WSL2/PySide6. Note that there is no big empty space. |

|
No, it's the screenshot from latest changes. I can't explain why there are still blank spaces surround bounding rect. I'm running on macos + pyqt5 |
|
Ah, I see that the bounding rectangle is tight but the viewbox is not in your screenshot. Could you try out the example in #2561 on both #2561 and #2565 on your macOS system and see if there are any differences? Or even better, try out the script in #2565 (comment) |
|
|
||
| p.setPen(symbolPen) | ||
| p.setBrush(symbolBrush) | ||
| for pos, outliers in self.outlierData.items(): |
There was a problem hiding this comment.
I think I made a mistake, deviceTransform should be used instead of mapToScene.
But if we follow ScatterPlotItem's code, we can just use QPainter.transform instead
        tr = p.transform()
        for pos, outliers in self.outlierData.items():
            for o in outliers:
                x, y = (pos, o) if self.opts["locAsX"] else (o, pos)
                p.resetTransform()
                p.translate(*tr.map(x, y))
                p.scale(symbolSize, symbolSize)
                p.drawPath(symbol)
Add
BoxplotItemand example code.Closes #2542 .