This repository provides all resources required for setting up comprehensive monitoring of ShinyProxy on Kubernetes. The setup uses Loki (together with promtail) for collecting logs of ShinyProxy, the ShinyProxy Operator and any app running in ShinyProxy. Prometheus is used for gathering metrics of ShinyProxy and the apps (i.e. the resources used by the apps). The setup also includes Grafana, together with six dashboards for visualizing all logs and metrics.
The retention of both Loki and Prometheus is set to 90 days.
Screenshot Screenshot (continued)
- Datasource: Prometheus
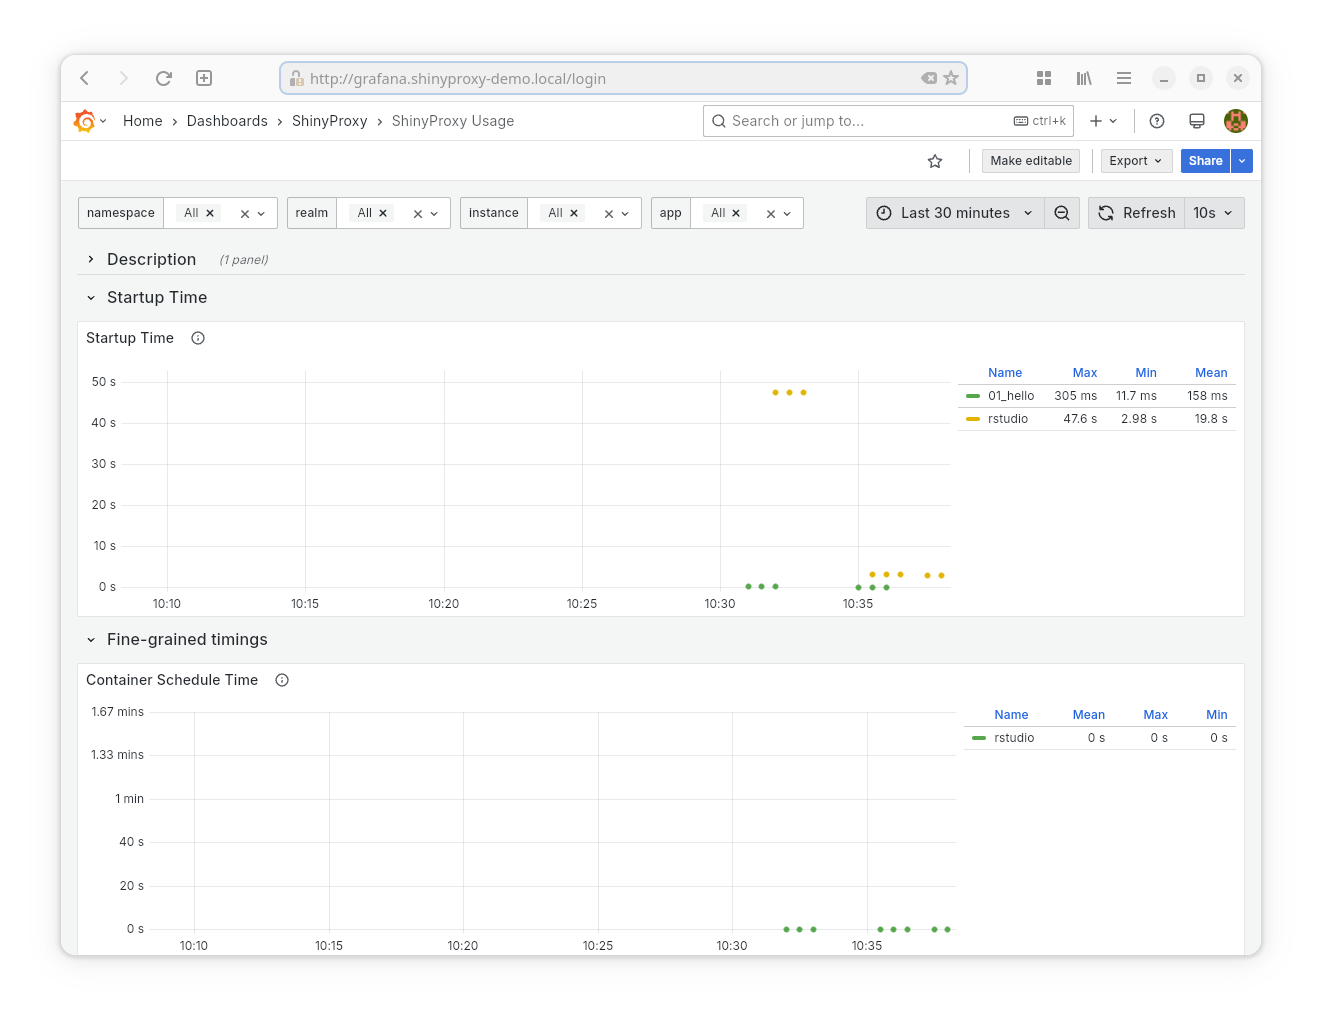
- Goal: provide inside in the current usage and performance of ShinyProxy.
- Provided statistics:
- App Startup Time
- Fine-grained timings
- Container schedule time (available on Kubernetes): the time needed for the container to get assigned to a node. Includes the time to launch a new node if the cluster needs to scale-up.
- Image pull time (available on Docker and Kubernetes)
- Container initialization time (available on Docker, Docker Swarm and Kubernetes): any time needed to start the app which is not part of the other metrics
- Application Startup time (available on Docker, Docker swarm and Kubernetes): the time between the start the application process and when the app is reachable by ShinyProxy. For example, in the case of the Shiny app, this is the time the R process takes to startup and be reachable on its webserver.
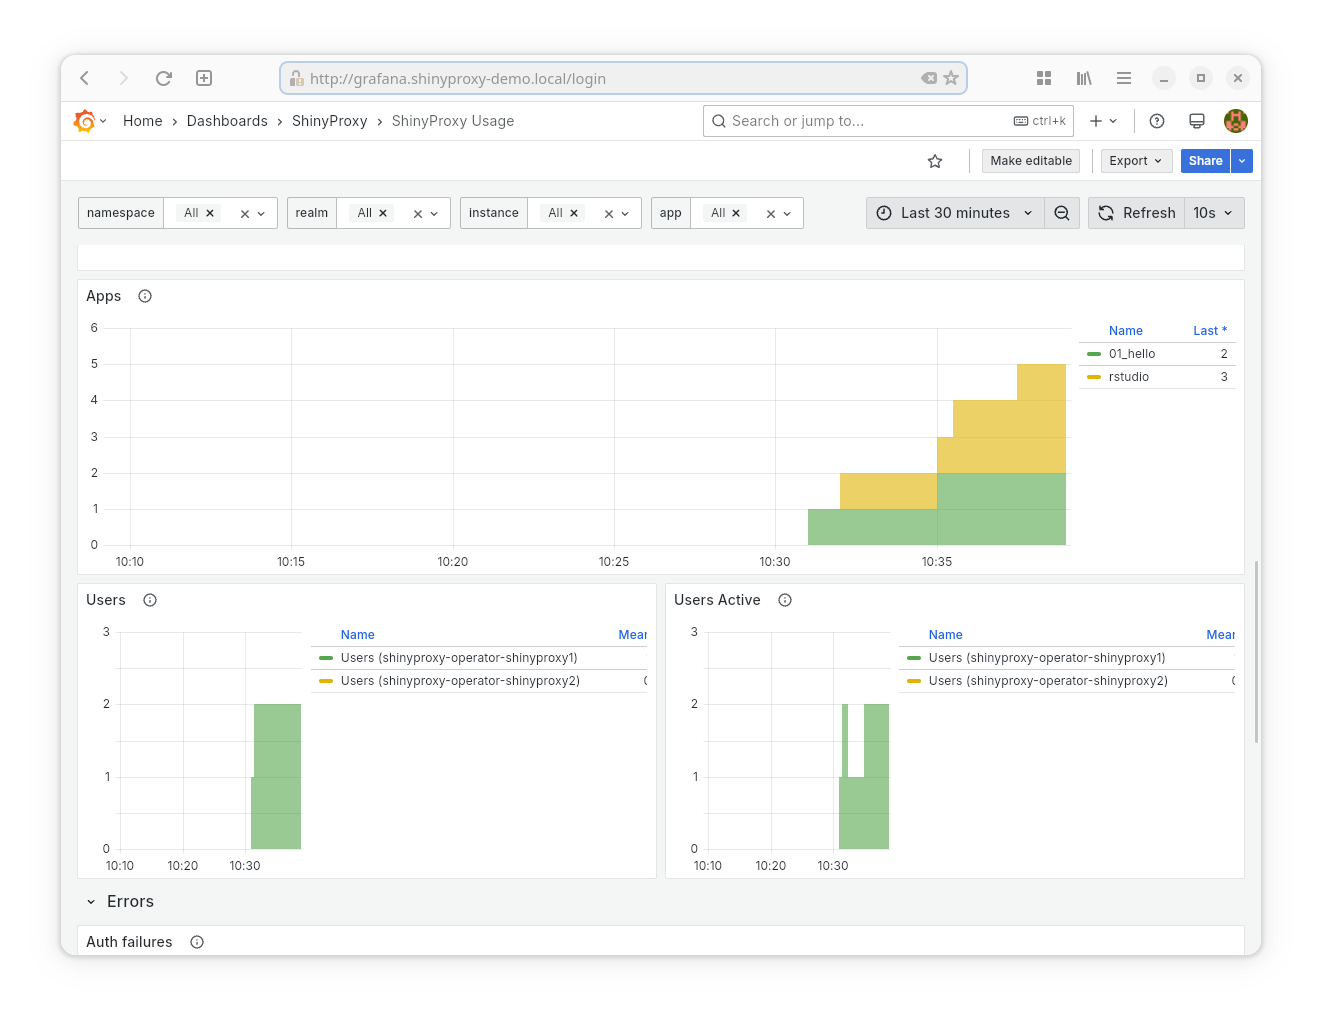
- App Usage Time
- Number of running apps (per app name)
- Number of logged-in users
- Number of active users
- Number of auth failures
- Number of app start failures
- Number of app crashes
Note: the last three panels of this dashboard can somtimes show a too high value, e.g. the app crashes dashboard could list two app crashes while in reality only a single app crashed. This is caused by a limitation in Prometheus.
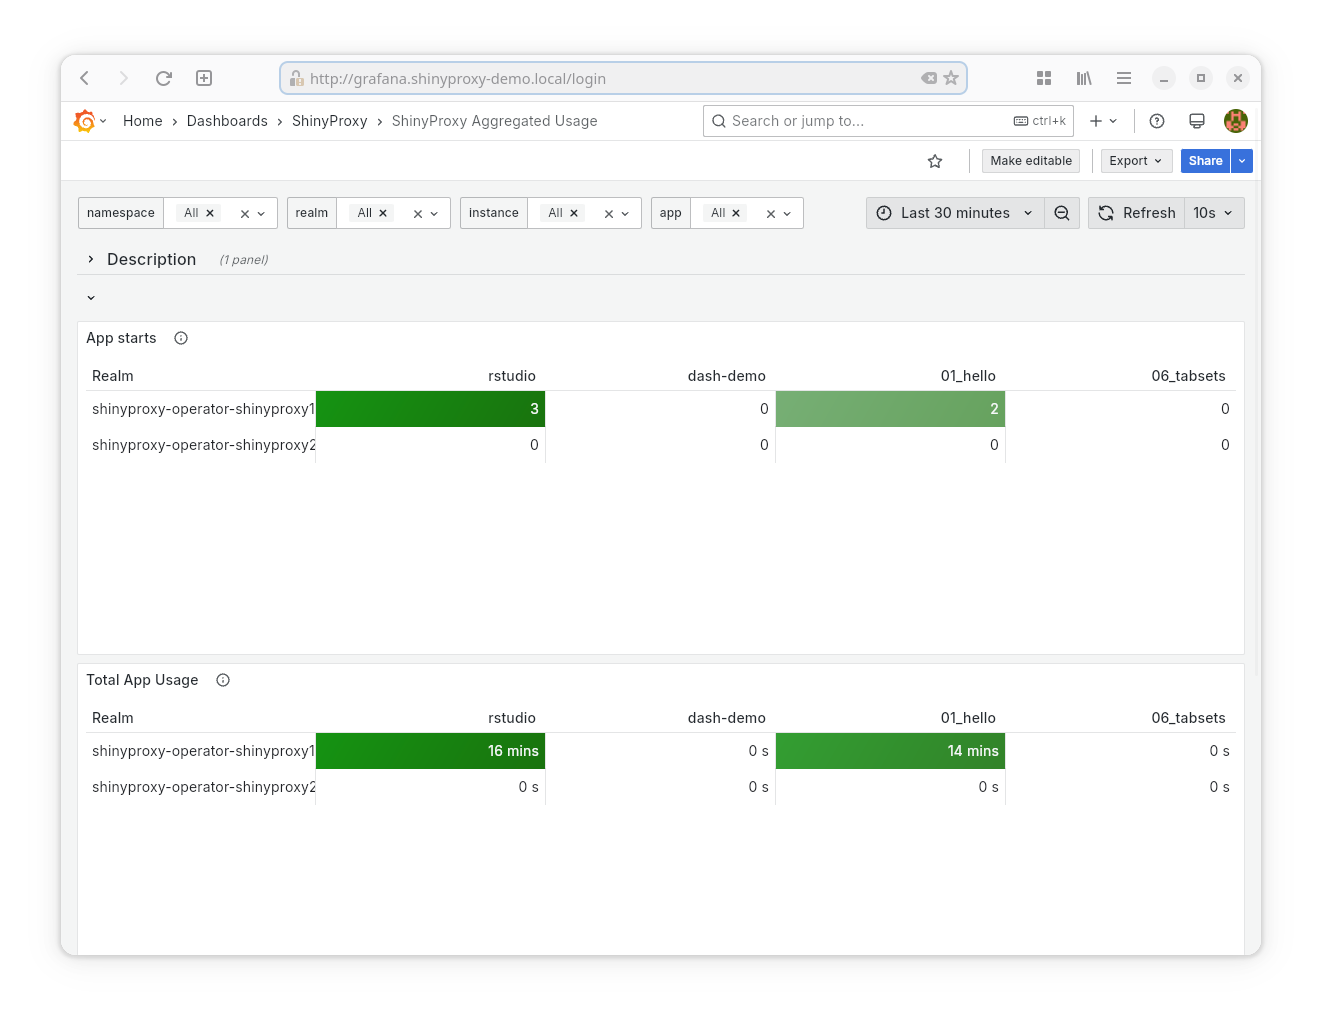
- Datasource: Prometheus
- Goal: provide inside in the long-term usage and performance of ShinyProxy.
- Provided statistics:
- Number of times an app has been started (per app)
- The total time an app has been used (per app)
- The average time an app is used (per app)
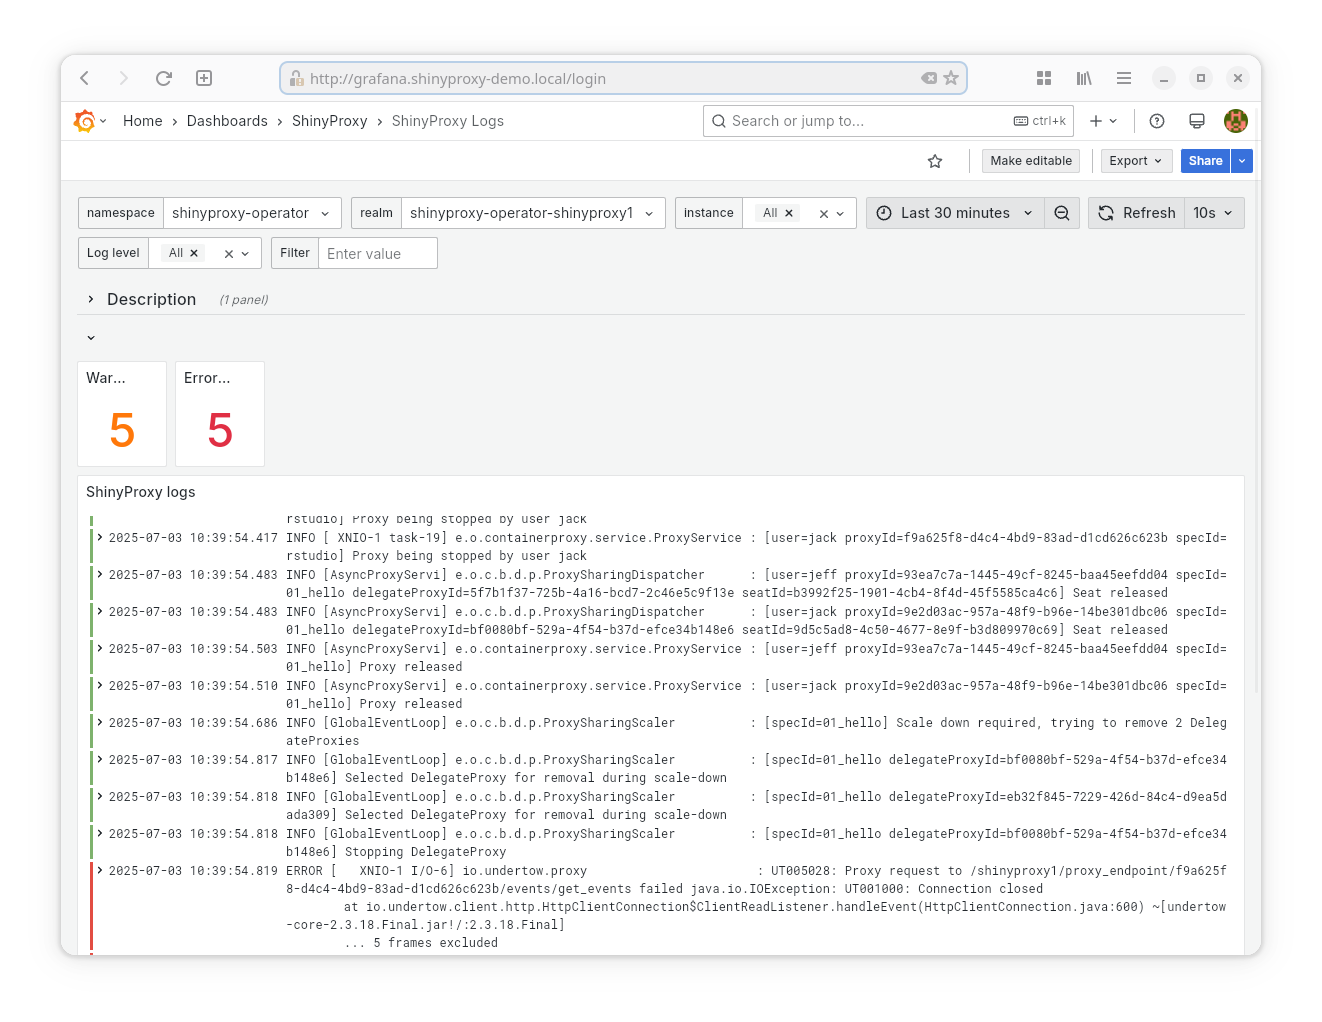
- Datasource: Loki
- Goal: show the logs of the ShinyProxy server
- Provided statistics:
- Number of warnings
- Number of errors
Note: This requires ShinyProxy to log using the JSON format.
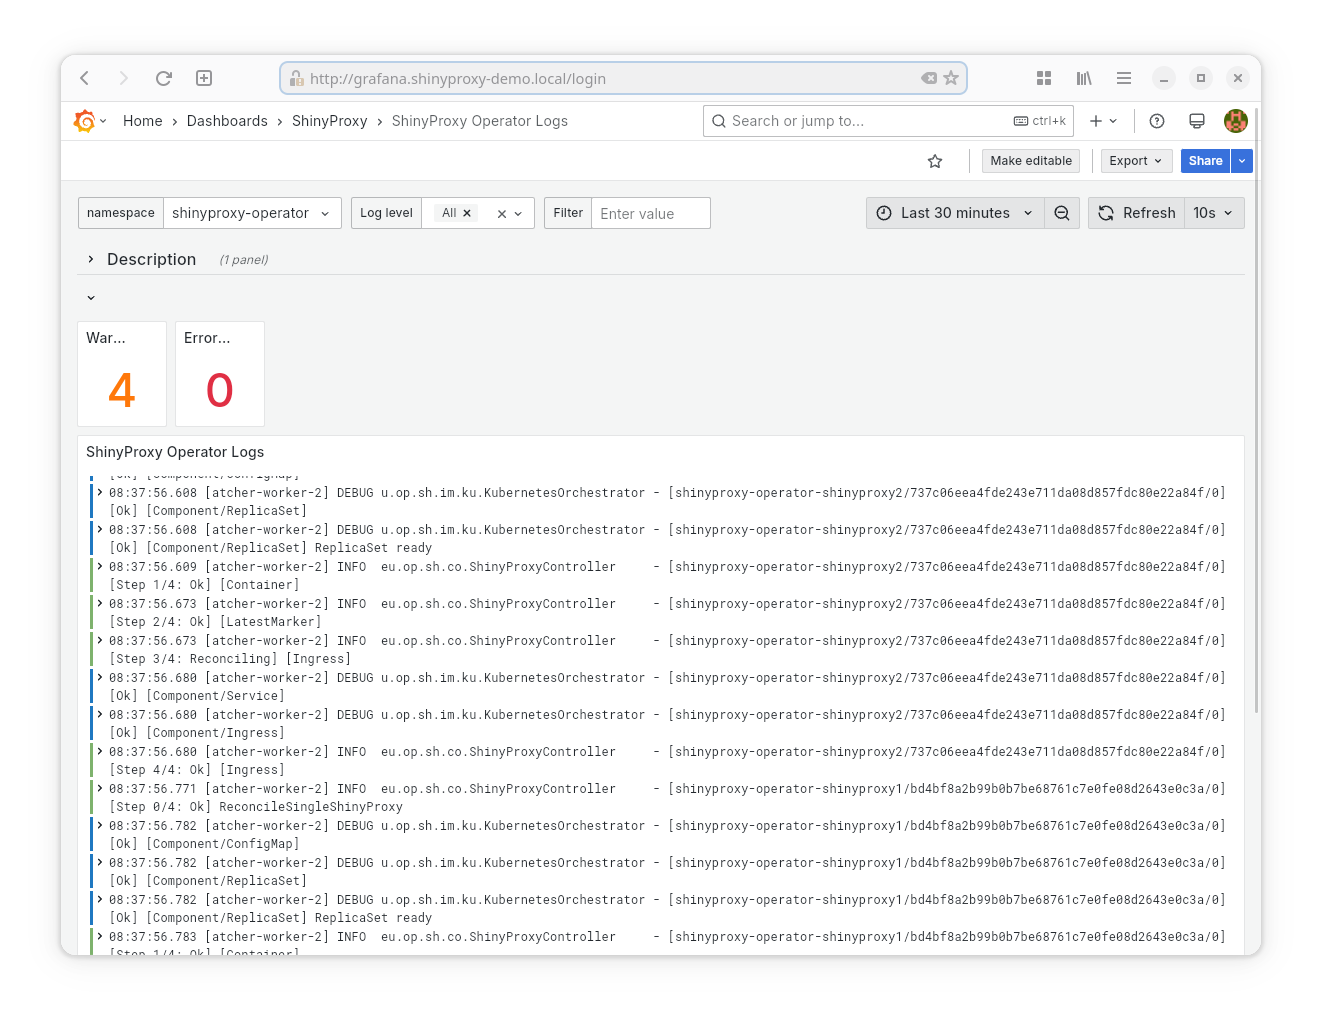
- Datasource: Loki
- Goal: show the logs of the ShinyProxy Operator
- Provided statistics:
- Number of warnings
- Number of errors
Note: promtail is configured such that it recognizes when Java outputs a stack trace and therefore collects this as a single log message. We could improve and optimize this by adding an option to the ShinyProxy Operator to log to JSON.
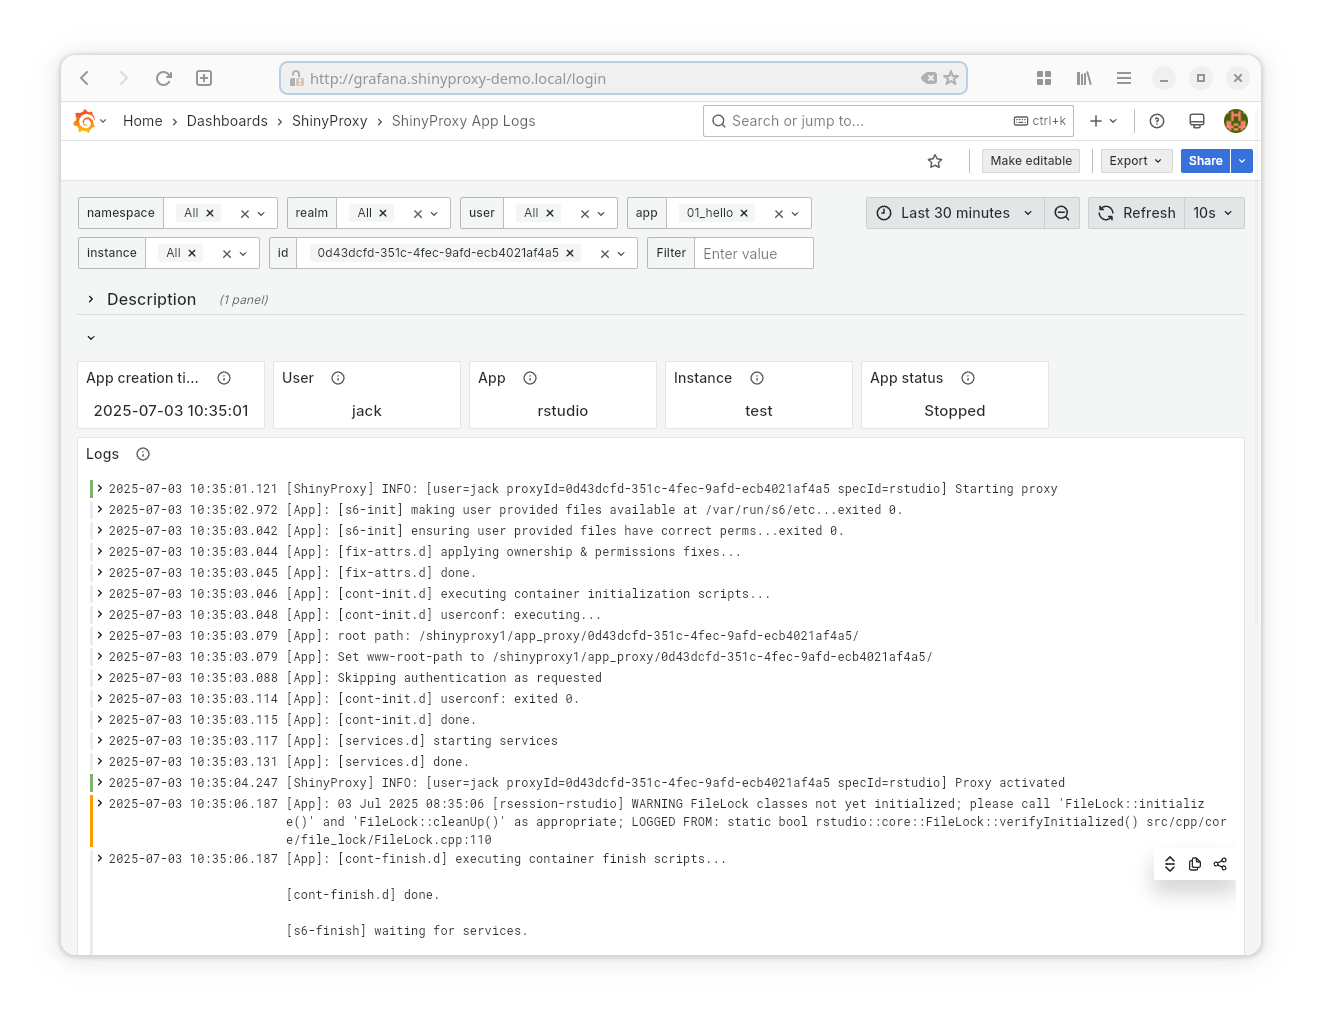
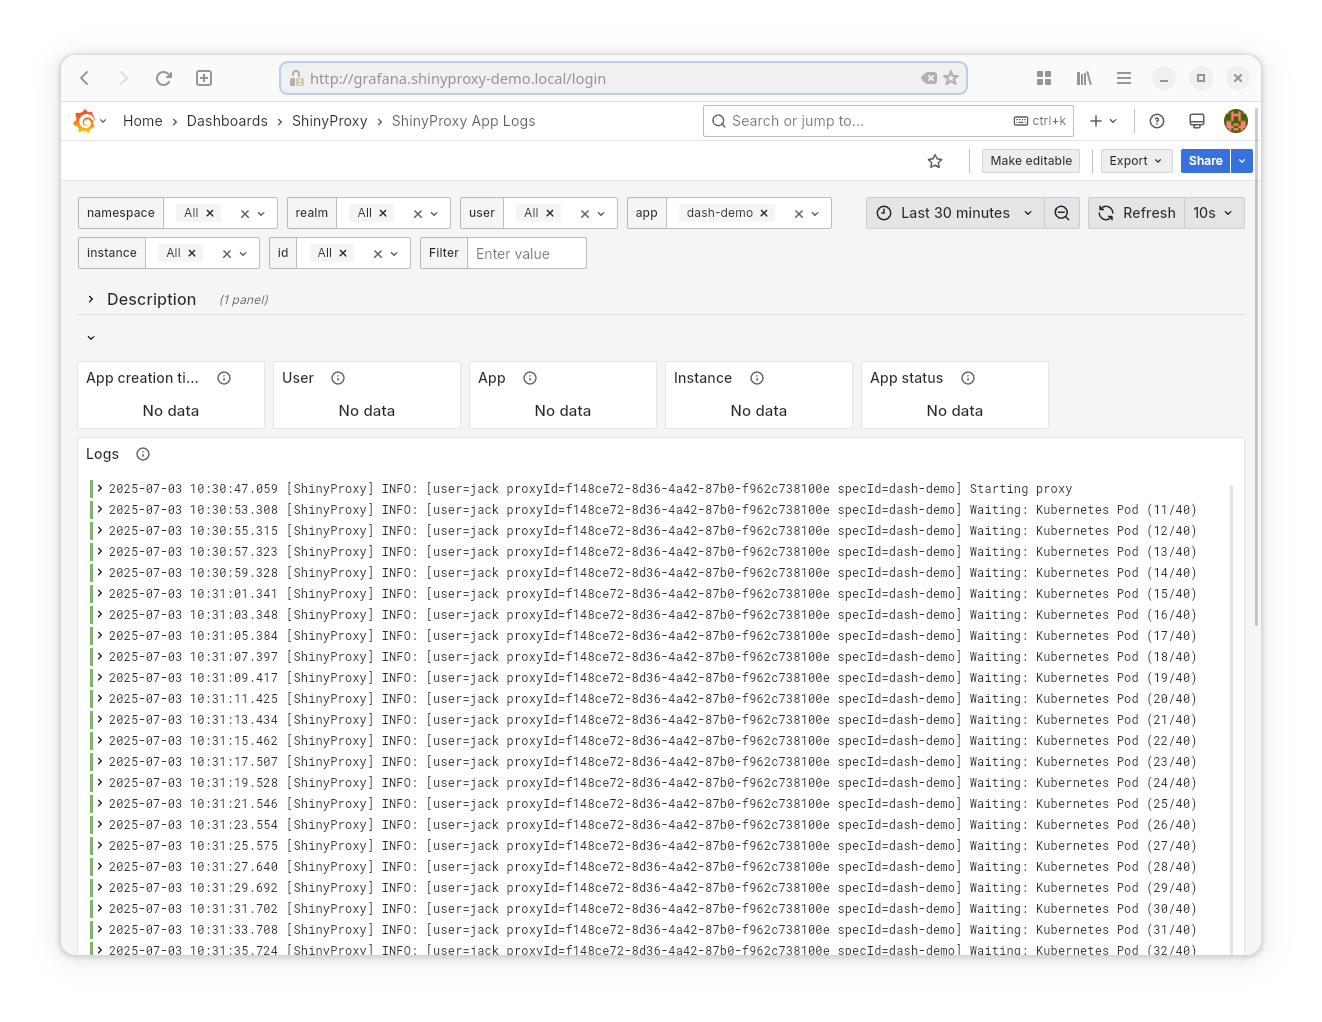
- Datasource: Loki
- Goal: show the logs of any app started by ShinyProxy.
- Provided statistics:
- The time when the app was created. Combined with the filters, this should make it easier to find the correct container (id).
Note: this dashboard also works when apps are run in different namespaces than the namespace of the ShinyProxy server. As an example, the Dash application in ShinyProxy 1 runs in a different namespace.
Note: this dashboard also shows parts of the ShinyProxy log that are relevant for this app.
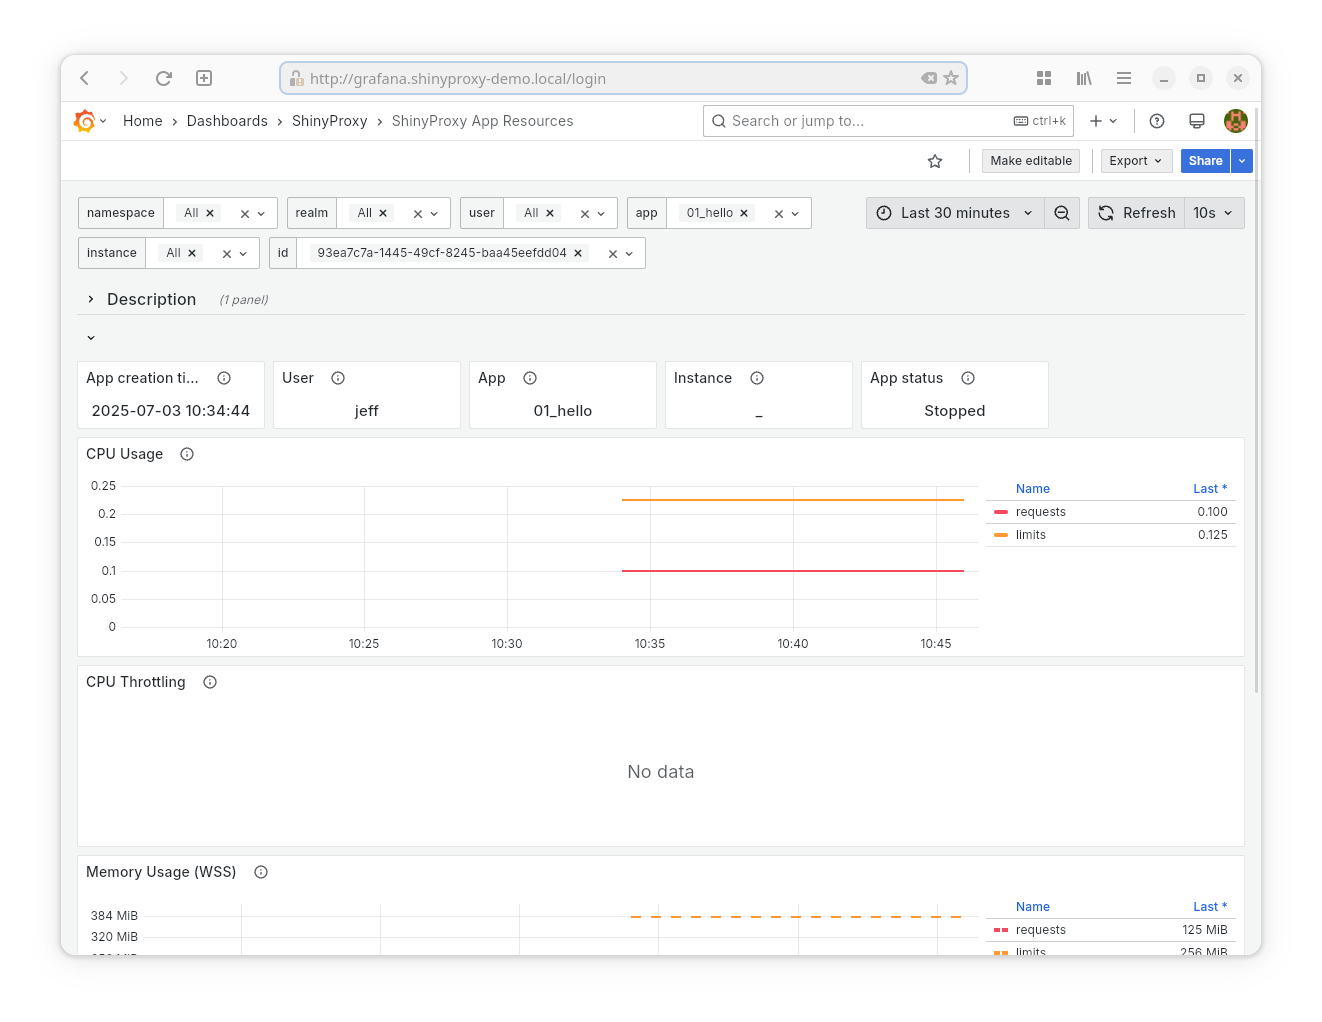
- Datasource: Prometheus
- Goal: show the resources (CPU, Memory, Network) used by any app started by ShinyProxy.
- Provided statistics:
- Current CPU usage
- CPU Limit and Requests
- CPU Throttling
- Current memory usage
- Memory Limit and Requests
- Total network traffic (both transmitted and received)
Note: this dashboard also works when apps are run in different namespaces than the namespace of the ShinyProxy server. As an example, the Dash application in ShinyProxy 1 runs in a different namespace.
Both Loki and promtail are used to collect the logs for all relevant dashboards.
The upstream Loki helm chart is used. No tweaks are needed to make it work with
ShinyProxy (although parallel processing was disabled). In contrast, the
configuration of Promtail must be changed to better work with ShinyProxy. See
the overlays/promtail/configs/promtail.yaml
file. Some important changes are:
-
in the
kubernetes-podsscrape_config an extra section was added to not process any logs of ShinyProxy or the ShinyProxy operator. These logs are processed by theshinyproxy-and-operator-podsjob.- action: drop regex: '(shinyproxy)|(shinyproxy-operator)' source_labels: - app
-
the
kubernetes-podsscrape_config was changed to process and store some ShinyProxy specific annotations. These annotations are added automatically to any app started by ShinyProxy. These must be stored in Loki, in order to be able to retrieve the logs of an app by specifying the name of the app. -
the
shinyproxy-and-operator-podsscrape_config was created in order to process logs of the ShinyProxy server and ShinyProxy Operator. The pipeline of this scrape_config ensures that multiline stacktraces are correctly processed as a single log line. Finally, the job also stores some labels relevant for ShinyProxy servers.
The Prometheus setup is based on the kube-prometheus stack.
The following changes are made to the configuration of Grafana:
overlays/monitoring/configs/dashboardscontains the Grafana dashboards.overlays/monitoring/configs/datasources.yamlconfigures Prometheus and Loki as a datasource for Grafana.overlays/monitoring/configs/grafana-dashboardSources.jsoncreates a folder for the ShinyProxy dashboards.overlays/monitoring/patches/grafana.deployment.yamladapts the Grafana deployment to use the ShinyProxy dashboards. It also uses the latest version of the 8 series of Grafana and adds a PVC for storage.overlays/monitoring/resources/grafana-storage.pvc.yamlcreates a PVC for Grafana.- all dashboards are displayed in the timezone of the browser, show the data for the last 30 minutes and refresh every 10 seconds. In order to enforce this consistency a script is provided to normalize the dashboards.
Kube state metrics is an
"Add-on agent to generate and expose cluster-level metrics." Information exported
by this add-on is used in the ShinyProxy App Resources dashboard. The
configuration (overlays/monitoring/patches/kubeStateMetrics-deployment.yaml)
is changed to index additional annotations as labels into
the kube_pod_annotations metric. This is then used by the dashboard to
populate the variables (or filters) so that users can easily find their pod
based on the name of the app etc.
The changes to the Prometheus config are:
overlays/monitoring/patches/prometheus-k8s.clusterrole.yamlgives Prometheus additional permissions, to viewServiceMonitor,PodandServiceresources on cluster level.overlays/monitoring/resources/shinyproxy.servicemonitor.yamlsetups aServiceMonitorsuch that Prometheus collects the metrics of ShinyProxy. Note: this only collects the metrics of ShinyProxy servers running in theshinyproxy-operatornamespace.
This section demonstrates how to set up this stack in minikube.
-
Start minikube
minikube start --kubernetes-version='v1.22.11' --addons=metrics-server -
Setup ingress (the ingress setup by minikube is too old and causes issues with its validating webhook):
helm upgrade --install ingress-nginx ingress-nginx --repo https://kubernetes.github.io/ingress-nginx --namespace ingress-nginx --create-namespace --set controller.hostPort.enabled=true
-
Configure web access to the cluster. First get the IP of minikube using:
minikube ip
Next, add the following entries to
/etc/hosts, replacingMINIKUBE_IPby the output of the previous command;MINIKUBE_IP grafana.shinyproxy-demo.local MINIKUBE_IP operator-demo.local -
Set up Loki
cd overlays/loki
kustomize build | kubectl apply --server-side -f -
cd ../..
Note: re-run the command if it fails when it cannot find some CRDs.
-
Set up Promtail
cd overlays/promtail
kustomize build | kubectl apply --server-side -f -
cd ../..
-
Set up Prometheus and Grafana
cd overlays/monitoring
kustomize build | kubectl apply --server-side -f -
cd ../..
Note: re-run the command if it fails because it cannot find some CRDs.
-
Set up the demo ShinyProxy Operator deployment:
cd overlays/shinyproxy
kustomize build | kubectl apply --server-side -f -
cd ../shinyproxy1-app
kustomize build | kubectl apply --server-side -f -
Note: re-run the command if it fails because it cannot find some CRDs.
You can now log in into shinyproxy on http://operator-demo.local/shinyproxy1
and http://operator-demo.local/shinyproxy2 with the users jack and jeff (both
have as password password). You can log into grafana
on http://grafana.shinyproxy-demo.local, with the username and password admin.
This repository uses the same version numbers as ShinyProxy. Always use the same version of ShinyProxy and this repository.
In release 3.1.0 of this repository, all components were upgraded. In order to maintain your logs and metrics, it's important to take the following steps when updating:
- edit line 50
of
overlays/loki/configs/config.yaml: change the day to be one day after you upgrade Loki. E.g. if you update this on2024-03-25(25 March 2024), change the date to2024-03-26. If you do not modify this line, you will no longer be able to access logs from before the upgrade. See the Loki docs for more information.
(c) Copyright Open Analytics NV, 2022-2024.