pip install -r requirements.txt
in the terminal. Then to run the training process for the LSTM model along with the data collection, data cleaning and preprocessing, type
python -m main.py
and then to collect the test data as well as perform the weekly based predictions with visualizations, type
python -m predict.py
Sentiment Analysis to Classify Depression from Twitter Using Tweets Before andAfter COVID-19 Through Different NLP Approaches
Camille Porter, Olof Johansson, Savya Sachi Gupta
Independent project in course DAT450: Machine Learning for Natural Language Processing
Chalmers Institute of Technology, Sweden
We aim to understand the affect of the COVID-19 pandemic on mental health, specifically depression, by performing sentiment analysis on ‘tweets’ shared on the social media service Twitter. We selected the United Kingdom and Ireland for our analysis as they had a government instituted lockdown across the country, which provides us with a definitive date as a reference point to gauge trends before and after. In order to understand how a lockdown affects depression, we sampled tweets from these locations and trained two different models to detect depression in tweets — a LSTM model, and theDistilBERT model, which is a condensed form of BERT. We scraped 5,000 tweets for each week that we measured during multiple time periods. The LSTM model performed better than DistilBERT yielding an accuracy of 0.94 as compared to 0.90 for DistilBERT. We found a 2-3% bump in the levelof depression two weeks after lockdown started, but no longterm changes.In order to maximize the locations included in our analysis, we used the longitude/latitude method. Using Google Earth, we determined that the Isle of Man is approximately at the center of the UK. Using the measurement tool on Google Earth, we found that a 550 kilometer circle around the Isle of Man covered all of UK and Ireland without touching France. In order to train the model we sourced tweets in two halves. One half of tweets related to depression, and another half of tweets that were non-depressive. This enables accurate labeling of data that helps train the model. The words we used to label depressive tweets were : depressed, lonely, sad, depression, tired, and anxious. The words that were labeled non-depressive were: happy, joy, thankful, health, hopeful, and glad. For each word specified above, we scraped 1,000 tweets, resulting in a training set size of 12,000 tweets. 80% of the tweets were selected for training and 20% for testing. Subsequently, for analyzing, we sourced 5,000 tweets per week for three different time periods; three months before and after the initial UK lockdown of 23 March, 2020, same period the year before and then a six months period starting from three months after the initial lockdown up to 17th of December, 2020. The code for the tweet collection process is found in the twint_scraping.py file.
Prior to the training process, the collected tweets had to be cleaned, annotated, and combined as many raw collected tweets contain emojis, URLs, mentions and non-alphabetic tokens. Thus, a pre-processing step cleaned the tweets as above and also removed possible punctuation marks. Next, a vocabulary based on words from the training data was built which consisted of two dictionaries for encoding and decoding the input text data. Moreover, the encoding process also padded the input sequences to be the same length by adding a specific padding token. Additionally had the labels also be encoded as the training data were labeled with either depressive or not-depressive. These two categories were encoded into corresponding integers of 0 and 1. This code for these processes are found in the data_cleaning.py file and the preprocessing.py
The initial model used for the sentiment analysis was a standardized embedding, that converts input integer tokens into real-valued data, followed by a Long-Short-Term-Memory (LSTM) model with an added feed-forward layer with dropout as output layer. The initial states, h0 and c0, of the LSTM network were zero initiated and the output of the feed-forward output layer was then fed into a sigmoid function, also used as the activation function in the LSTM network. As the problem is binary classification, the loss was thereafter computed by the binary cross entropy loss (BCE). Lastly, the decoding of the output from the predictions on the test data was done as
The code for the LSTM model and the training function is found in models.py file and train.py file respectively.
In addition to our LSTM model, we wanted to try a stateof-the-art transfer learning model. We decided to use DistilBERT, a smaller version of Bidirectional Encoder Representation from Transformers (BERT). BERT is a bidirectional LSTM with multi-head attention. The model implementation and training for the DistilBERT is found in the Twitter_Classification_DistilBERT.ipynb file.
The code to run the training process of the LSTM model is found in main.py file. The results of the training progress and accuracy metrics for the LSTM model are shown below. The highest validation accuracy for this model was 0.94.

The corresponding results for the DistilBERT model is further shown here.
Since our LSTM model has a greater validation accuracy, we will select that model performing our time period analysis in the next section.
The results show the forecast of the percentage of depressive tweets, weekly collected, predicted by the LSTM model. From three months before UK initial lockdown to three months after, the following results were obtained. The code for making the predictions is found in the predict.py file.

The results of the same time period for the previous year is further shown below.

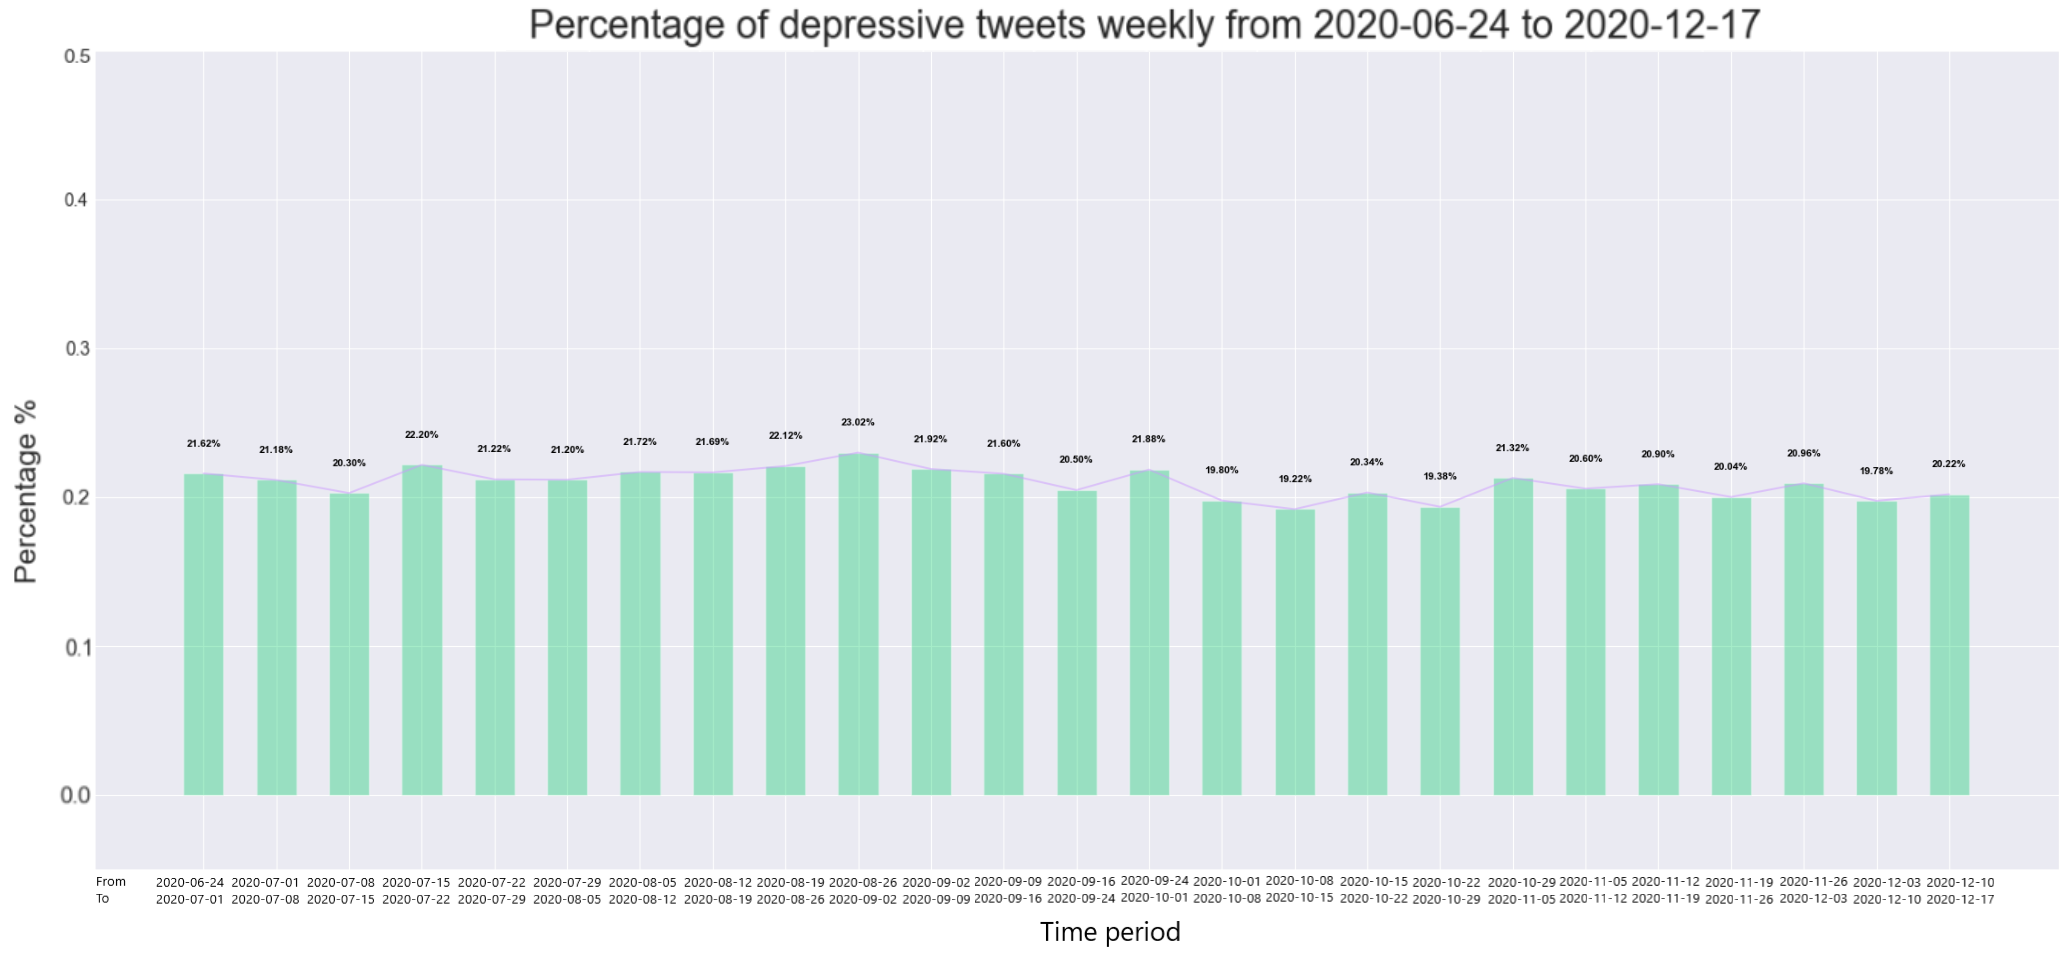
The final analysis from three months after the start of the initial UK lockdown up to the 17th of December, 2020, is shown below.
The combined result, for comparison, is further shown below.

An animation of the weekly results are also visualized below.
| 3 months before and after UK lockdownn | Same period previous year | 3 months after lockdown to recent |
 |
 |
 |