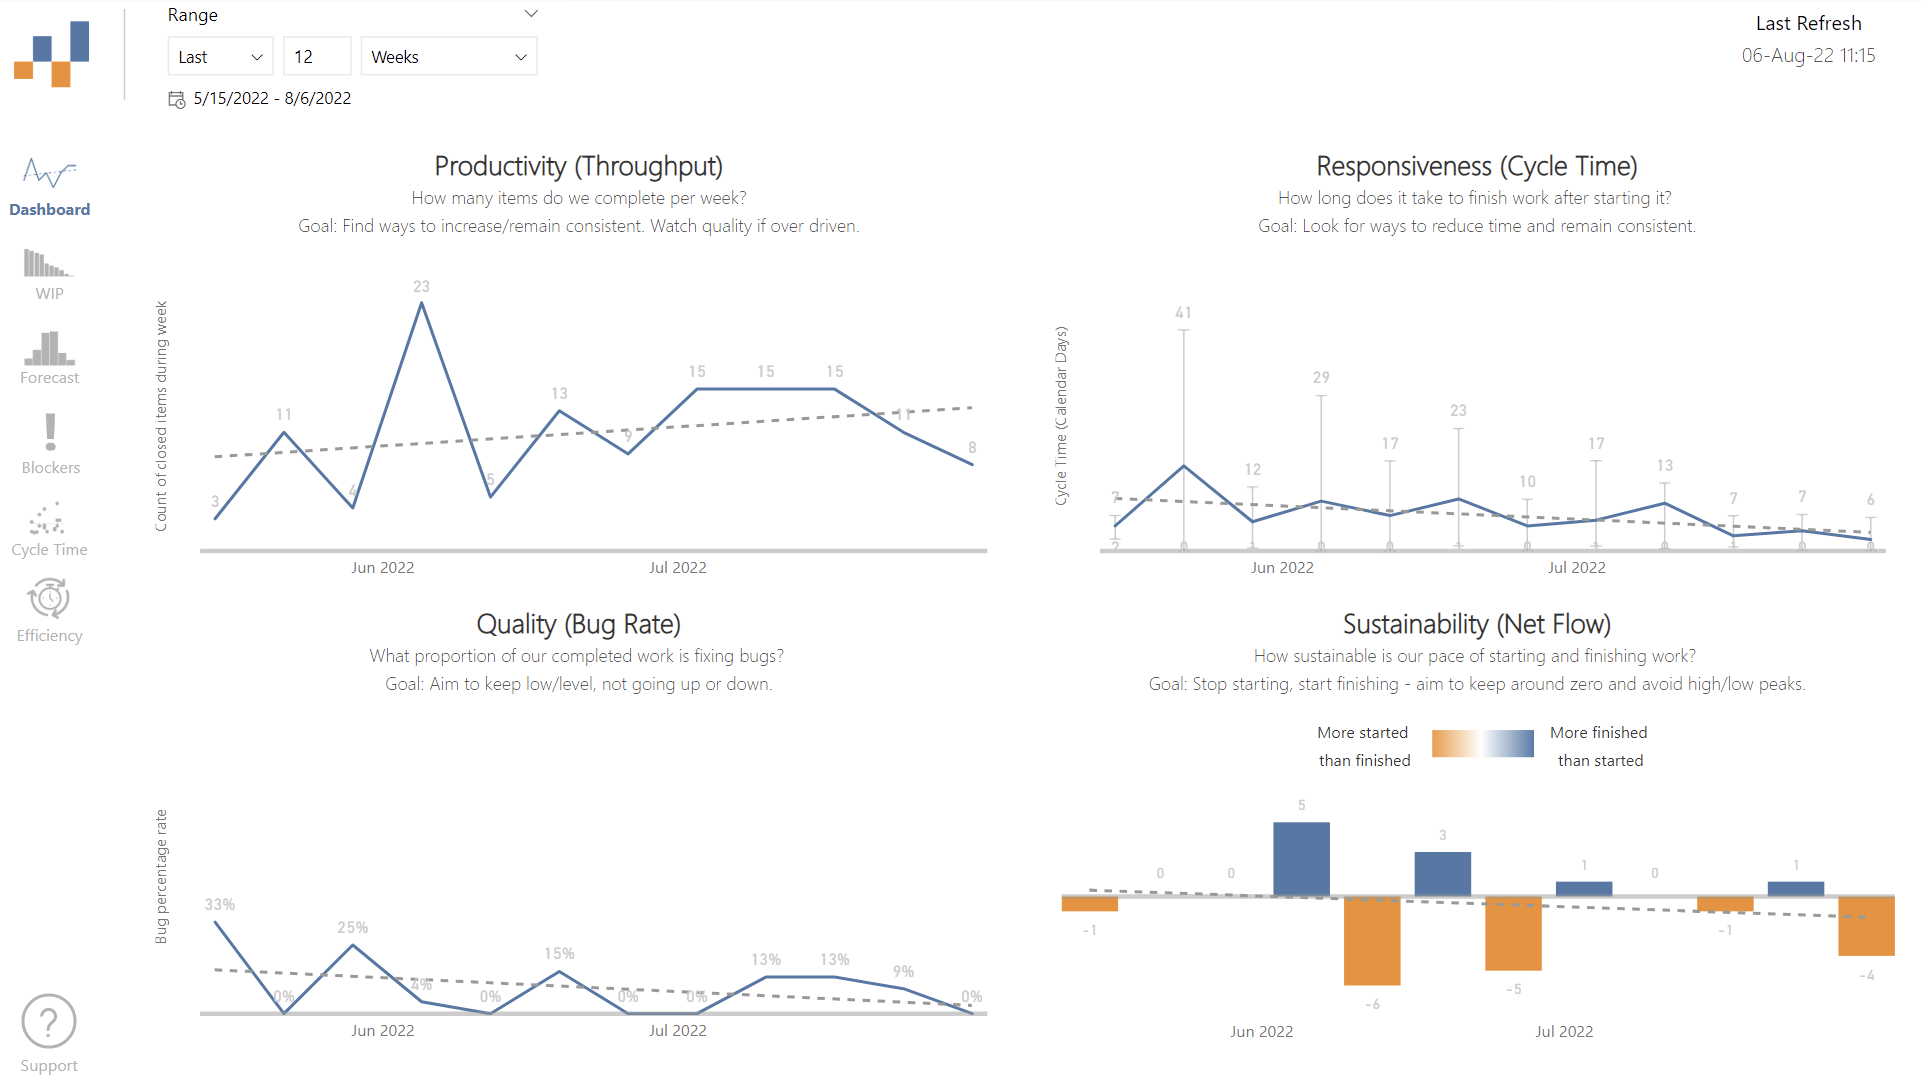
This dashboard is for all Agile teams using Jira Cloud, who want to leverage their data to have better conversations and make more informed decisions. It was built due to years of frustration with 'velocity' and other traditional agile metrics. These are centered on flow, as well as providing forecasting techniques you can use to give customers greater confidence/transparency in your delivery.
- Make sure you have the latest version of Power BI Desktop
- Follow these steps to setup a Jira API token and note it down (e.g. copy/paste into Notepad)
- Download the template file
- Then you're good to get started!
- Open the .pbit file in Power BI Desktop
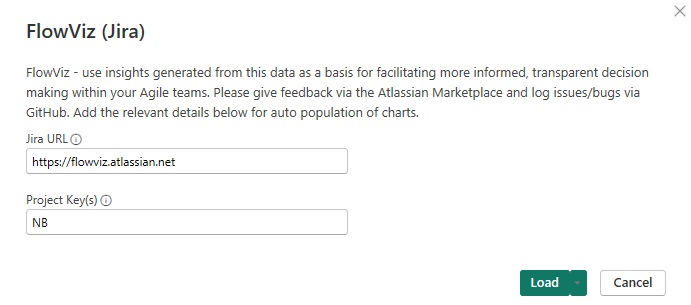
- Add your Jira URL
- Add your Jira Project Key(s)
Don't confuse the project name with the project key, a common mistake! Your project key will be in the URL when viewing an item.
- It should then look something like this:
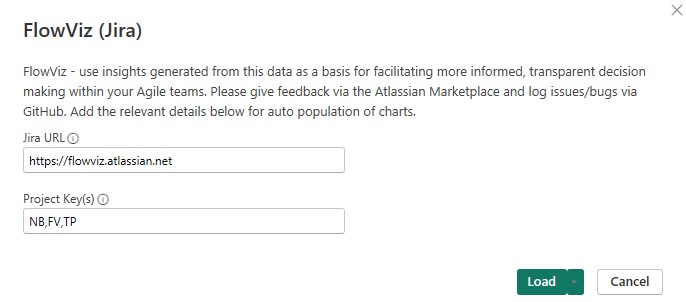
- For multiple projects, it should look like:
- Hit 'Load'
- You will be prompted for a login, choose Basic and enter:
- Your email associated with your Jira account for your username
- Your API token you created in the Prerequisities
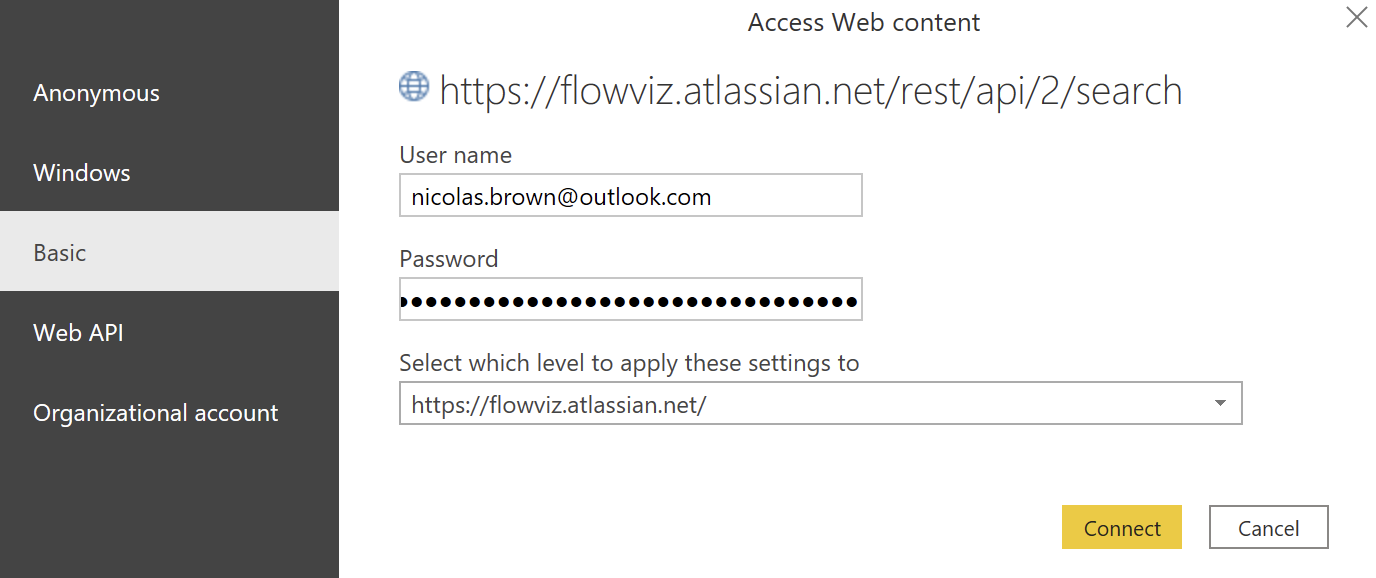
- Then hit 'Connect' and wait for the data and charts to load!
There is a FlowViz Fundamentals course now available
For questions on charts, how to use them and other questions check out the Wiki.
FlowViz is built and maintained by Nicolas Brown. Please email nicolas.brown@outlook.com for ideas, improvements and feedback.
Thank you to all the people who helped inspire and/or build this, providing feedback and answering my questions especially: