Moses Rahnama
With the spread of COVID-19 and a sharp decline in global air travel, Jet Fuel prices and time spreads, cracks, regional diffs, and Jet Fuel-Diesel (Heating Oil / “HO”/Gasoil) spreads can present significant trading opportunities. As a result, an increasing number of commodity traders are actively looking at Jet Fuel. This model is able to find potential price dislocations in the following areas:
- Cracks: Jet Fuel cracks are the most direct instrument to take a position on aviation industry’s relative fundamentals against crude.
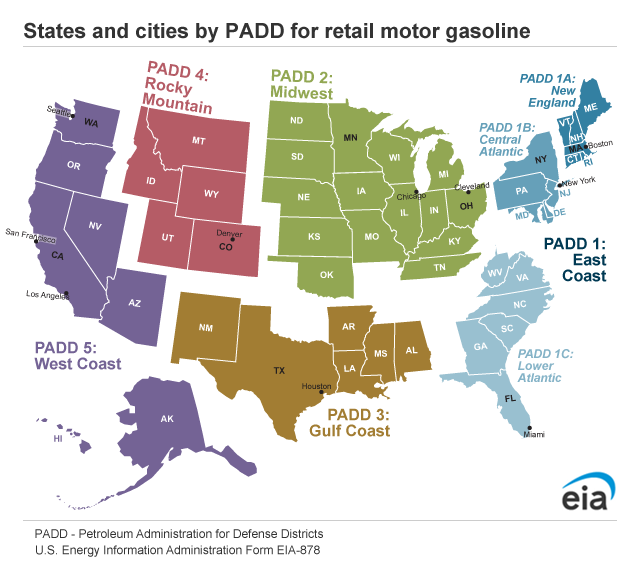
- Regional diffs: New York (East Coast or PADD 1), LA (West Coast or PADD 5), and Gulf Coast (USGC or PADD 3) all have active Jet Fuel markets and very often have different fundamentals (refinery outages, storms and hurricanes etc.).
- Time spreads: The futures curves for these regions can also move dramatically based on the underlying fundamentals.
- Jet Fuel–Diesel spreads: These two products have a very similar cut in the distillation process and are often used for relative trades. This is generally a much more active trade in Asian markets.
Below you can see PADD 1 stats up until June 23


Miles travelled is number of departures multiplied by average flight distance. This is an extremely accurate metric for modelling daily demand using a linear model.
- OpenSkyNetwork for detailed air traffic data https://opensky-network.org/. OpenSky has strong coverage only for the US and Europe. OpenSky covers near 70% of US flights, which is enough this project. This is the link to the REST API https://opensky-network.org/apidoc/rest.html .(Their Python API is dysfunctional)
- The opensky_api.py file in the python_modules folder collected 5 years of data from opensky and stored about 3GB of data in a local database. For this model, I have used air traffic for 50 busiest airports in the US to estimate regional Jet Fuel demand. Please ask OpenSky for license if you intend to use their data
- EnergyAspects (EA) for historical data, and balances forecast. EA is exceptionally strong in the oil and products markets, particularly Jet Fuel, and their estimates often forms consensus. (EA data is subscription based)
- The EIA for historical (and lagged) PADD level S/D data, and for more recent, but less detailed, weekly data.
- Bloomberg for historical prices.
All the data are collected automatically and the model is able to run as a fully automated platform.
I have constructed my analysis by following these steps:
Jet Fuel demand based on OpenSky and PADD level EIA demand data.
- This is done in the daily_demand_calculations file uploaded above.
- Table below is PADD 1 OLS regression results for Jet Fuel demand against "miles per day" travelled out of PADD 1 airports.
- Other PADDs have similar accurate results. Available in the daily_demand_calculation notebook.

2) Regional Balances
- I have used EIA weekly data for most recent balances.
- Supply: I will use 3rd party forecasts for this project. Refining runs are a function of margins and can be modelled with good accuracy based on forward cracks.
- Demand: I am using my model for daily demand forecast.
- Import/Exports: PADDs 1 and 5 rely heavily on imports. This can genrally be modelled on arbs based on shipping rates and price diffs with Europe and Asia. (This critical data is missing from this model. subscription based data are available)
Total U.S. weekly demand estimates vs DOE

3) Prices
- This is the only part of the project that I used R instead of Python. File is uploaded as LASSO.r.
- I ran LASSO to find the best model for each spread.
- The example I give here is LA_NY_M2 Jet Fuel spread. (I must mention again that imp/exp arbs are the key variables missing from the model)

linear model has the following output

Essentially every variable's error range crosses 0, which means the model is not useful.
But LASSO provides following coefs within min and 1se lambda (tuning factor)

and selects following variables for the model

CH_P5_PR is weekly change in Jet Fuel supply in PADD 5. CL_2_3 is time spread between CL1 and CL2. HO_1_2 is time spread between HO1 and HO2. Essentially change in Jet Fuel output in PADD 5 has the biggest impact on the spread. This is most likely because of constant refinery issues in California.
Table below provides the list of products and derivatives (with flat price ticker) used for this project. (full ticker list is in the Bloomberg directory)
| Bloomberg Ticker | Description | Unit |
|---|---|---|
| FGJSM1 Index | USGC Jet Fuel-Nymex HO | USd/gallon |
| FLJSM1 Index | LA Jet Fuel-Nymex HO | USd/gallon |
| FNJSM1 Index | NY Jet Fuel-Nymex HO | USd/gallon |
| FSNJM1 Index | New York Jet Fuel | USd/gallon |
| FSGJM1 Index | USGC Jet Fuel | USd/gallon |
| HO1 Comdty | Generic Nymex HO | USd/gal. |
| CL1 Comdty | Generic Nymex CL | USD/bbl. |
| FSCHM1 Index | CARB (California) Diesel | USd/gallon |
| FSGCM1 Index | Gulf Coast ULSD | USd/gallon |
| FSLJM1 Index | LA Jet Fuel | USd/gallon |