Prometheus exporter for Aeron metrics.
Data is scraped by prometheus.
./gradlew fatJar
Firstly we will need to run a aeron media driver.
To run the stats exporter simply run the following while media driver is running. Delay is optional defaults to 5 second. Port is compulsory argument.
java -cp build/libs/aeron-prometheus-stats-all-1.0-SNAPSHOT.jar -Daeron.dir=<same_directory_as_media_driver> co.fairtide.prometheus_aeron_stat.PrometheusAeronStat -port 1234 -delay <in_ms>
You can also run with the archive option (Only works with ArchivingMediaDriver). This prints out to console the archive details.
java -cp build/libs/aeron-prometheus-stats-all-1.0-SNAPSHOT.jar -Daeron.dir=<same_directory_as_media_driver> co.fairtide.prometheus_aeron_stat.PrometheusAeronStat -port 1234 -delay <in_ms> -archive
To see the options you can run.
java -cp build/libs/aeron-prometheus-stats-all-1.0-SNAPSHOT.jar co.fairtide.prometheus_aeron_stat.PrometheusAeronStat -help
-
Run a aeron media driver first.
-
Build the docker image
docker build -t prometheusaeron . -
Run the docker image. Configuration can be changed in docker-compose.yml file.
docker-compose -f docker-compose.yml up
Now your metrics are exposed through http://host:1234/metrics.
For delay and archive settings please manually change the run command in the docker compose file. Delay is set to 5 seconds in compose file. And archive is not being set.
Example of changing delay to 10 seconds and to print logs of ArchivingMediaDriver
        command: >
            bash -c "java -cp /opt/aeron-prometheus-stats/lib/aeron-prometheus-stats-all-1.0-SNAPSHOT.jar\
             -Daeron.dir=/dev/shm/aeron co.fairtide.prometheus_aeron_stat.PrometheusAeronStat -port 50051 -delay 10000 -archive"
Two main type of metrics are exposed
- System Counters
Counters of significant events observed in the system such as errors, counts, rates, and hints that further investigation should be taken. Aeron link -> System counters
- Derived stats from Stream Positions
num_channel - Number of channels that is going through media driver
num_subscribers - Number of subcribers on media driver
num_clients - Number of clients(subcriber and publisher) on media driver
The name of the stats almost directly come from aeron (link) It is renamed to suit prometheus conventions.
Command used to rename.
label.replaceAll(" ", "_").toLowerCase();
| metric | description |
|---|---|
| bytes_sent | Total number of open channels |
| bytes_received | Total number of open connections |
| failed_offers_to_receiverProxy | Total number of message consumers |
| failed_offers_to_senderProxy | Total number of queues in use |
| failed_offers_to_driverconductorproxy | Total number of exchanges in use |
| naks_sent | Total number ready and unacknowledged messages in cluster. |
| naks_received | NAKs received. |
| status_messages_sent | Status Messages sent. |
| status_messages_received | Status Messages received |
| heartbeats_sent | Heartbeats sent |
| heartbeats_received | Heartbeats received |
| retransmits_sent | Retransmits sent |
| flow_control_under_runs | Flow control under runs |
| flow_control_over_runs | Flow control over runs. |
| invalid_packets | Invalid packets. |
| errors | Errors. |
| short_sends | Short sends |
| failed_attempts_to_free_log_buffers | Failed attempts to free log buffers |
| sender_flow_control_limits_applied | Sender flow control limits applied |
| unblocked_publications | Unblocked Publications. |
| unblocked_control_commands | Unblocked Control Commands. |
| possible_ttl_asymmetry | Possible TTL Asymmetry. |
| controllableidlestrategy_status | ControllableIdleStrategy status |
| Loss gap fills | Loss gap fills |
Side note - running Arhive media driver will run a publisher on a channel.
| metric | description |
|---|---|
| num_channel | number of channels in use |
| num_subscribers | received bytes |
| num_clients | received packets |
1. Get the docker images
docker build -t prometheusaeron .
docker pull prom/prometheus
docker pull grafana/grafana
2. Run Aeron Media Driver, Prometheus, Aeron-prometheus-stats and grafana
Aeron Media Driver
Run aeron media drivers, publisher and subcribers. Link
Aeron-prometheus-stats
Configure the exposed port for prometheus and Aeron Directory in the docker-compose.yml file.
docker-compose -f docker-compose.yml up
Prometheus - Link
docker run --name my-prometheus \
    --mount type=bind,source=<PATH_TO_REPO>/examples/prometheus.yml,destination=/etc/prometheus/prometheus.yml \
    --network host \
    -p 9090:9090 prom/prometheus
Grafana - Link
docker run \
  -p 3000:3000 \
  --name=grafana \
  --network host \
  --user 1000 \
  grafana/grafana
Navigate to localhost:3000
User:admin
pass:admin
Add prometheus as data source
Then navigate to aeron-prometheus-stats dashboard with the below settings
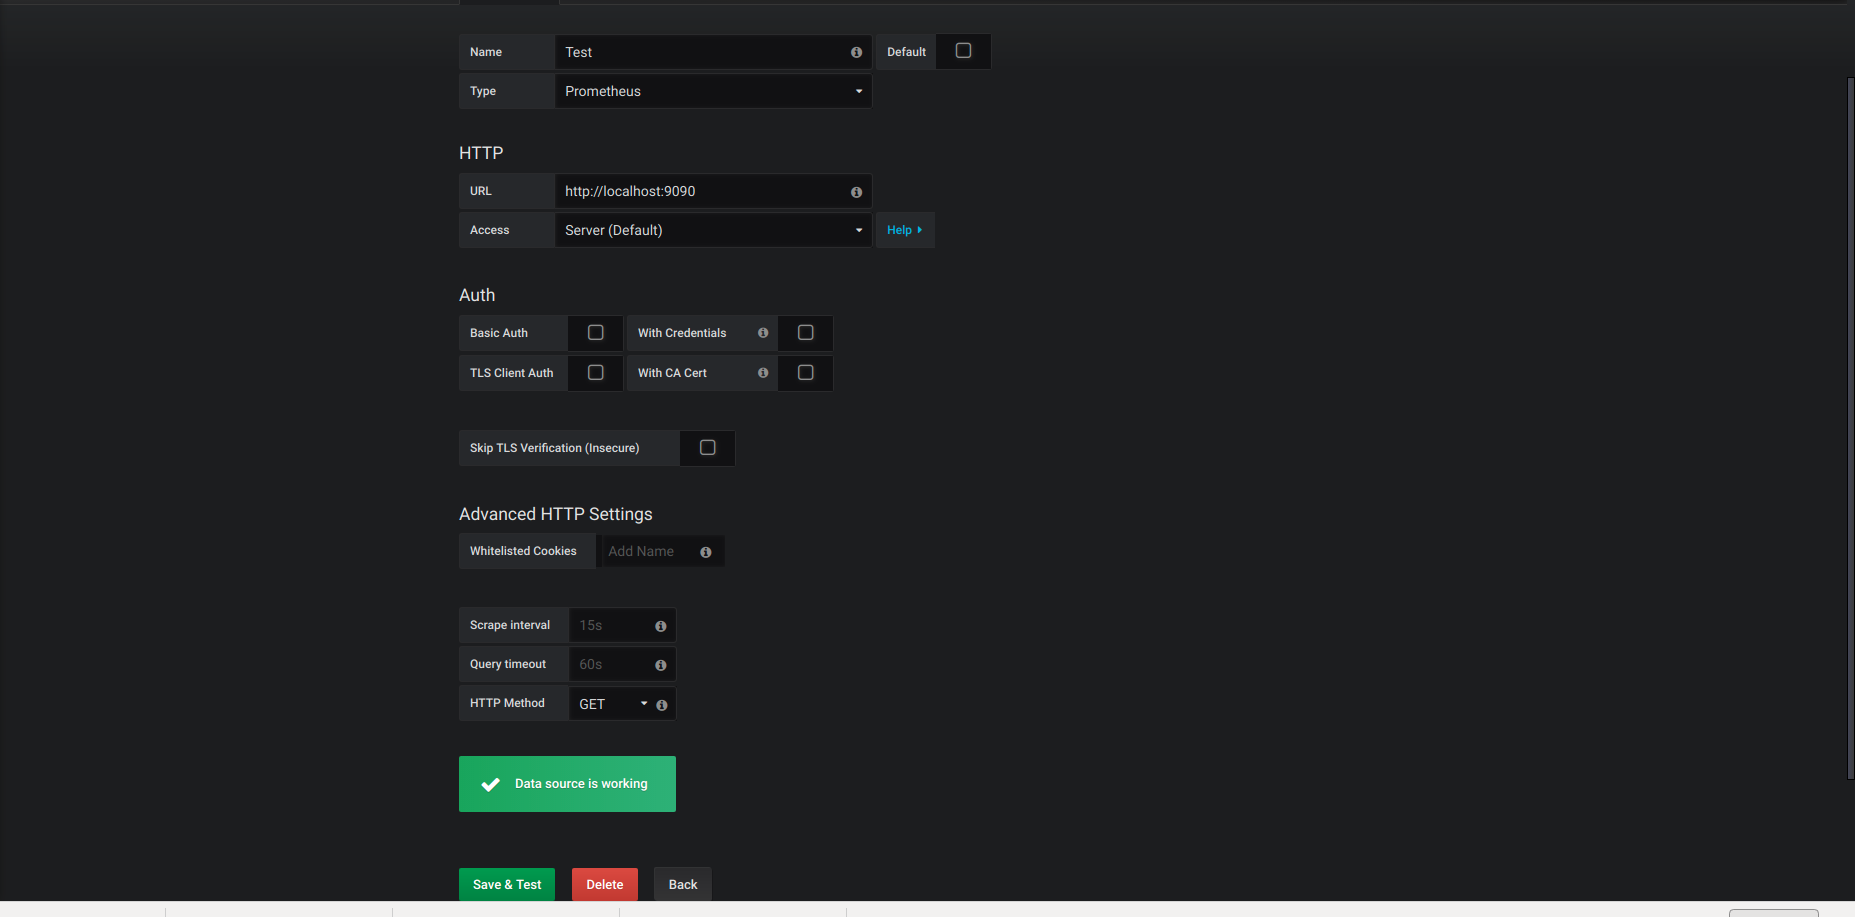
Then import the dashboard from <path_to_repo>/examples/grafana-aeron-dashboard.json
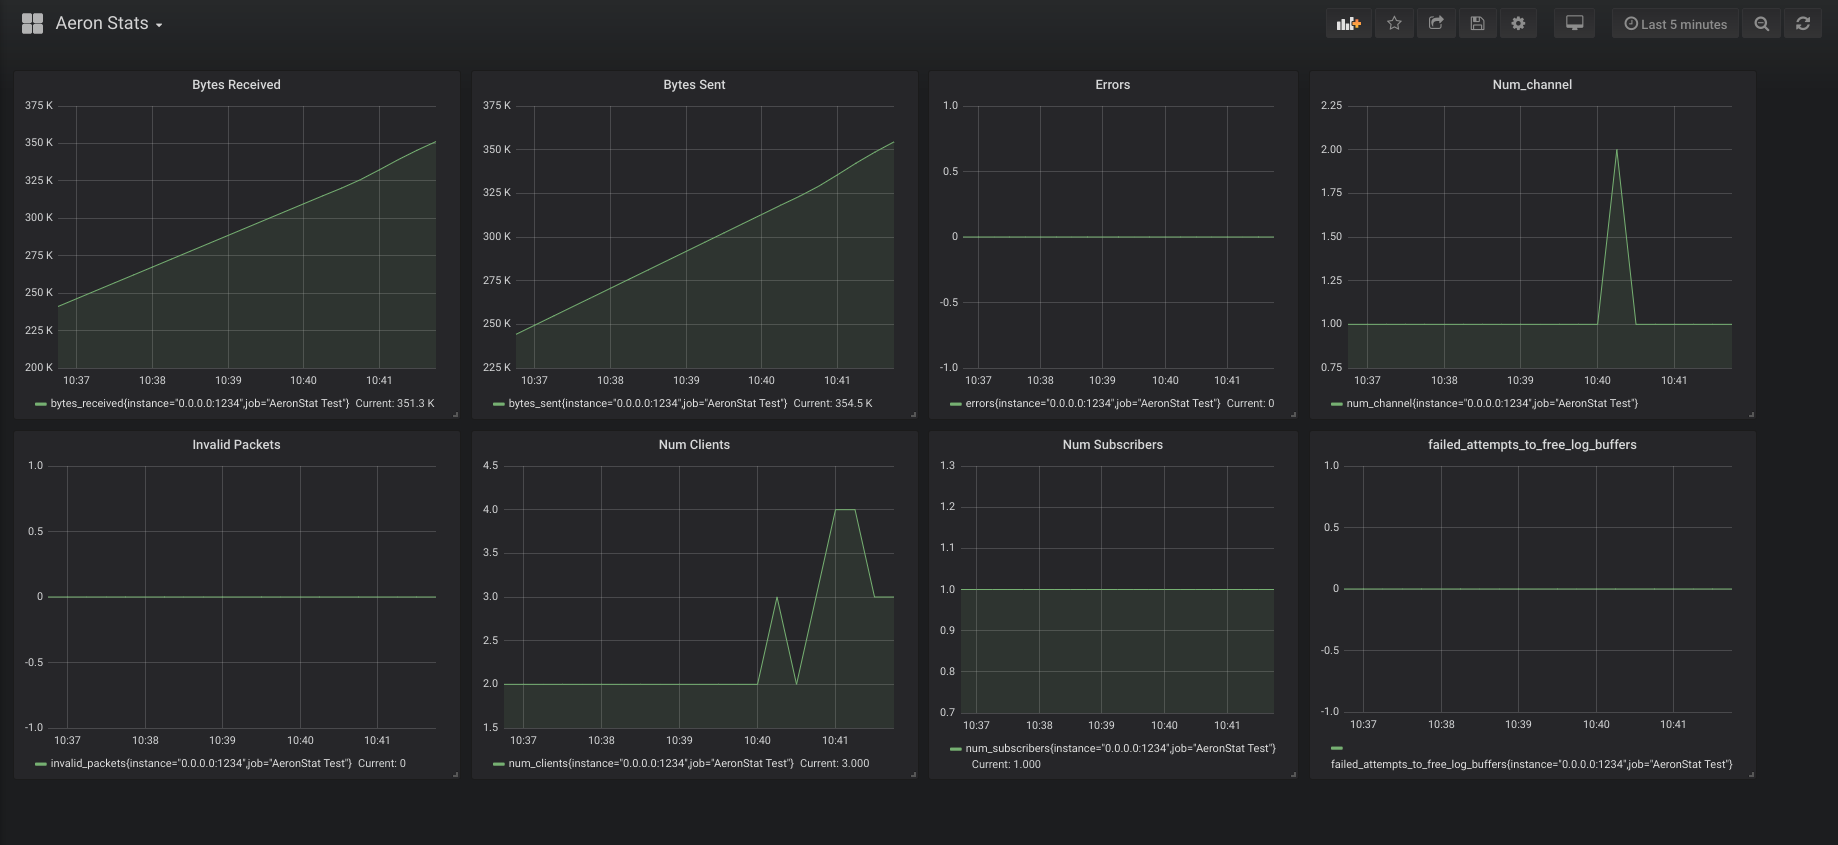
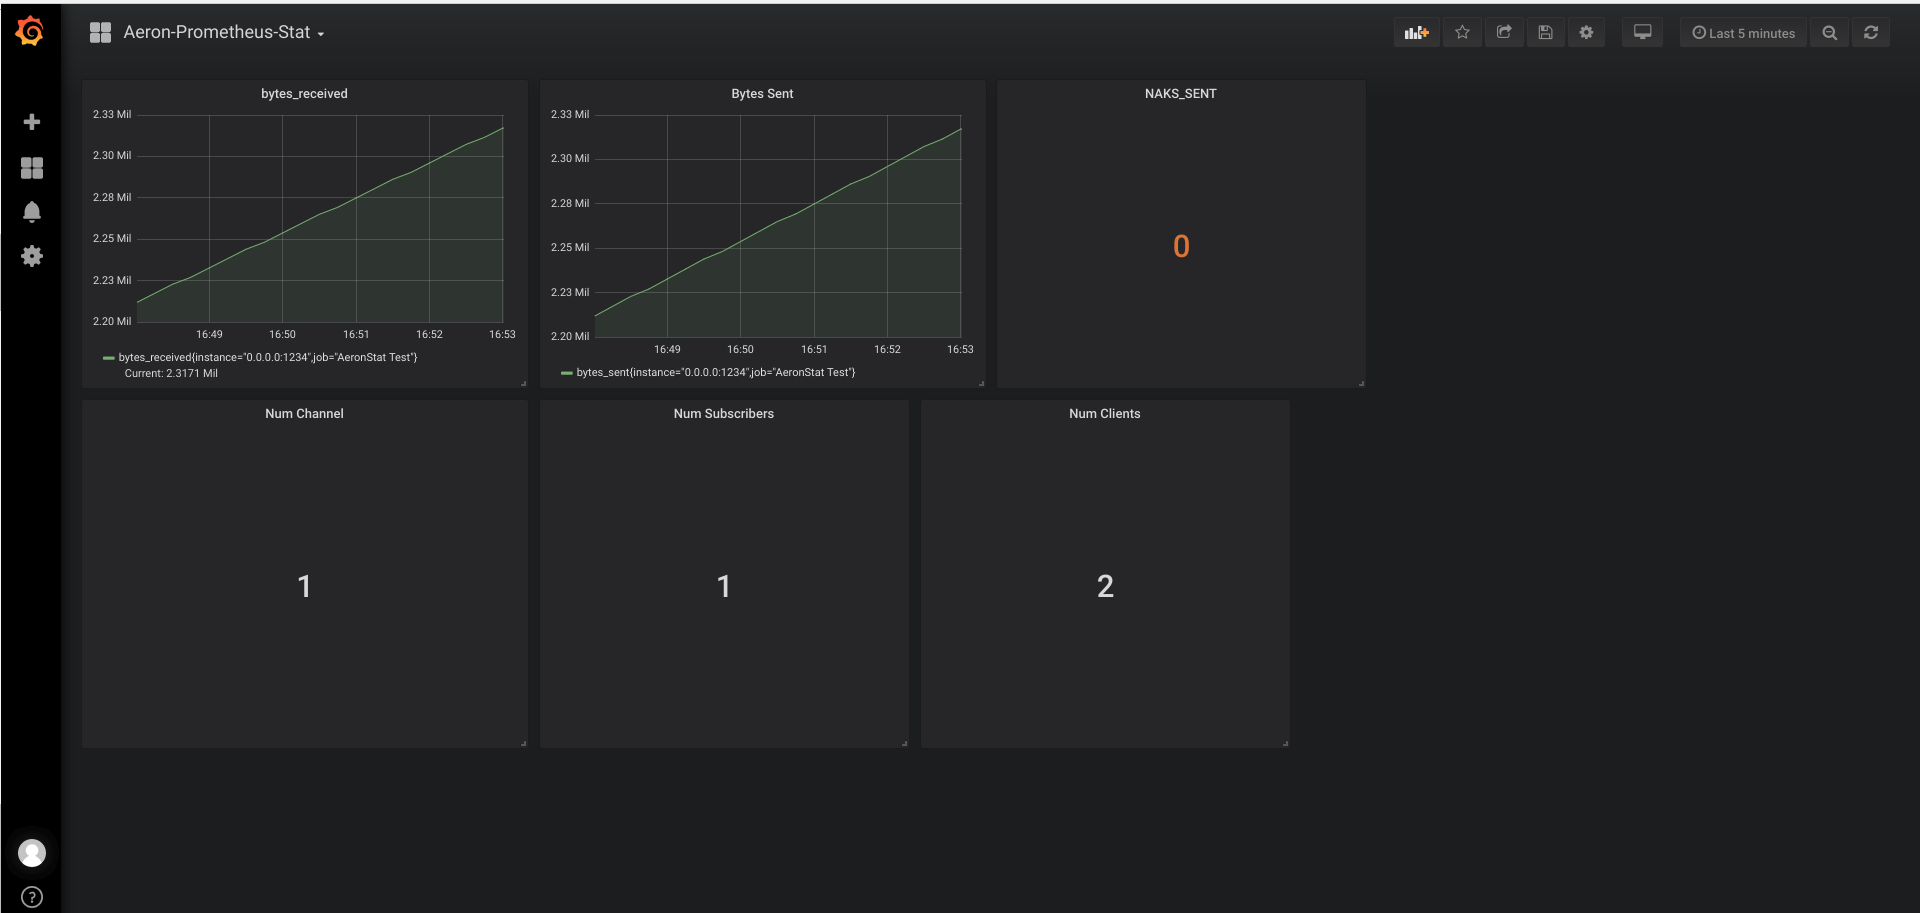
Example link
This is how it should look like
Copyright 2018 Fairtide Pte. Ltd.
Licensed under the Apache License, Version 2.0 (the "License"); you may not use this file except in compliance with the License. You may obtain a copy of the License at
http://www.apache.org/licenses/LICENSE-2.0
Unless required by applicable law or agreed to in writing, software distributed under the License is distributed on an "AS IS" BASIS, WITHOUT WARRANTIES OR CONDITIONS OF ANY KIND, either express or implied. See the License for the specific language governing permissions and limitations under the License.