Limited public demo instance: https://monitoringartist.shinyapps.io/monitoring-analytics/
If you like or use this project, please provide feedback to author - Star it ★.
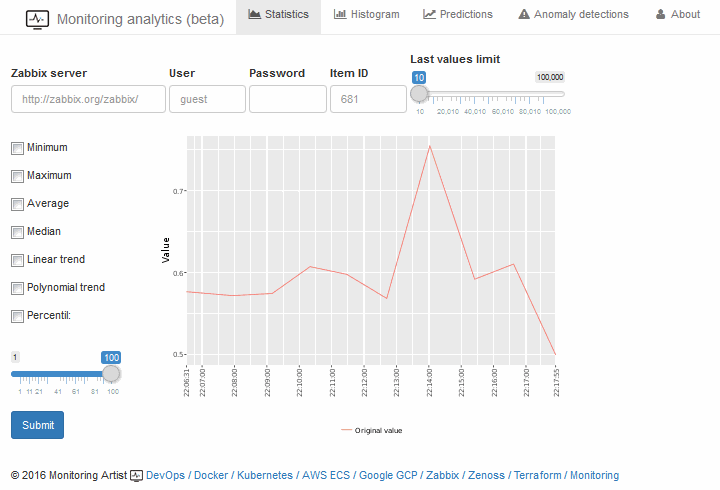
Yes, monitoring is not a rocket science usually. However your monitoring system keeps a lot of time series data. You can you use science / math / statistics and turn your data into knowledge, which can be used to improve your monitoring systems and settings. Don't estimate any static thresholds for your metrics. Set them based on your real values. If you don't know, what is normal value, then try to detect anomalies in your series. Remember, your only limitation is your data science imagination: histograms, linear/polynomial/... trends, prediction, anomaly detection, correlation, 3d visualization, heat map, ...
Overview of Monitoring Artist Dockerized monitoring ecosystem:
- Zabbix XXL - standard Zabbix 3.0 server/proxy/UI/snmpd/java gateway with additional XXL extensions
- Zabbix agent XXL - Zabbix 3.0 agent with Docker (Mesos/Chronos/Marathon) monitoring and systemd monitoring
- Zabbix templates - tiny (5MB) image for easy template deployment of selected Zabbix monitoring templates
- Zabbix extension - all templates - storage image for Zabbix XXL with 200+ community templates
- Kubernetized Zabbix - containerized Zabbix cluster based on Kubernetes
- Grafana XXL - dockerized Grafana with all community plugins
- Monitoring Analytics - R statistical computing and graphics for monitoring from data scientists
- Docker killer - Docker image for Docker stress and Docker orchestration testing
Please donate to author, so he can continue to publish other awesome projects for free:

docker run \
  -d \
  --name=shiny \
  -p 3838:3838 \
  monitoringartist/monitoring-analytics:latest
Deep monitoring knowledge and science skills are required, so only commercial support is available.
Devops Monitoring Expert, who loves monitoring systems and cutting/bleeding edge technologies: Docker, Kubernetes, ECS, AWS, Google GCP, Terraform, Lambda, Zabbix, Grafana, Elasticsearch, Kibana, Prometheus, Sysdig, ...
Summary:
- 1000+ GitHub stars
- 6000+ Grafana dashboard downloads
- 800 000+ Docker image pulls
Professional devops / monitoring / consulting services: