Tropical cyclone (TC) best-track datasets are analyzed, maintained, and hosted by several Regional Specialized Meteorological Centers (RSMCs), agencies, or projects all over the world. These agencies include:
- JTWC: Joint Typhoon Warning Center, Naval Oceanography Portal. This agency currently hosted TC datasets over several ocean basins except the North Atlantic Ocean i.e., western Pacific basin (BWP), North Indian Ocean (BIO), and Southern Hemisphere basin (BSH). https://www.metoc.navy.mil/jtwc/jtwc.html?best-tracks
- CMA: China Meteorological Administration. This agency only hosted the TC dataset over the western North Pacific. http://tcdata.typhoon.org.cn/en/zjljsjj_zlhq.html
- JMA: RSMC Tokyo-Typhoon Center, Japan Meteorological Agency. This agency only hosted the TC dataset over the western North Pacific https://www.jma.go.jp/jma/jma-eng/jma-center/rsmc-hp-pub-eg/trackarchives.html
- NHC: National Hurricane Center, National Oceanic and Atmospheric Administration. This agency hosted the TC datasets for both the North Atlantic Ocean and eastern North Pacific, which are not covered by JTWC. https://www.nhc.noaa.gov/data/#hurdat
- IBTrACS: International Best Track Archive for Climate Stewardship. This project merges the best-track datasets already exist at other agencies (more than the above) into a worldwide TC database. https://www.ncdc.noaa.gov/ibtracs/
| RSMC | WNP | NEP | NAT | NIO | SIO | WSP | SAT |
|---|---|---|---|---|---|---|---|
| JTWC | X | X | X | X | |||
| CMA | X | ||||||
| JMA | X | ||||||
| NHC | X | X | |||||
| IBTrACS | X | X | X | X | X | X |
Unfortunately, different agencies use different data formats. This python-based project besttracks, aims to provide a unified interface to access these datasets in different formats, and organizes them into a unified data structure called TCSet and TC, which are based on pandas.DataFrame that are convient for python users. Simple plot of track and intensity is also easy and some basic statistics are also provided.
Up to now, the datasets from the above agencies are supported. It would be good to add more agencies and more formats. We also provide the parser function for CMA operational forecast data (BABJ format), which is also popular in China.
Requirements
besttracks is developed under the environment with numpy (=version 1.15.4), pandas (=version 1.0.3), xarray (=version 0.15.1), matplotlib (=version 3.3.1), and cartopy (=version 0.18.0). Older versions of these packages are not well tested.
Install from github
git clone https://github.com/miniufo/besttracks.git
Parsing best-track dataset CMA into TCSet would be as simple as:
from besttracks import parse_TCs
# parse dataset from CMA
TCs_CMA = parse_TCs('./CH*.txt', agency='CMA')
# Brief describe the dataset
print(TCs_CMA)
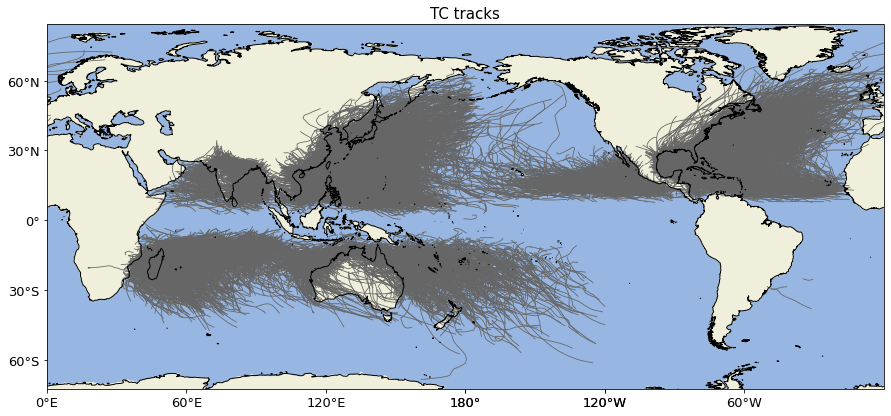
# Plotting all TC tracks
TCs_CMA.plot_tracks()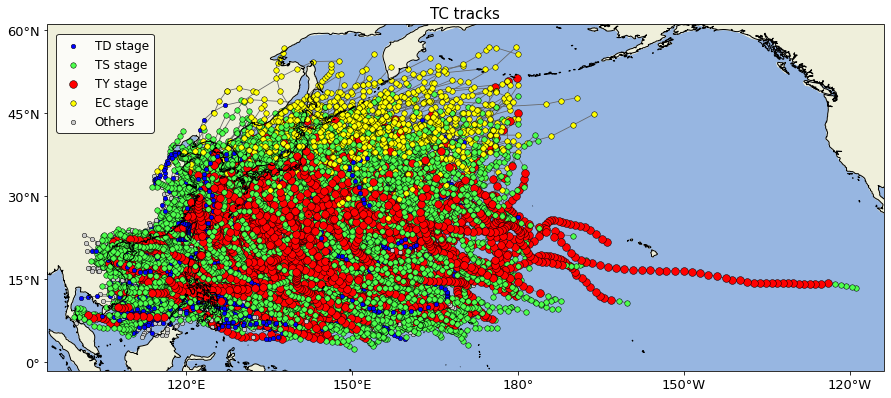
One can also bin the tracks into gridded statistics (also known as PDF distribution) as:
# binning the tracks into gridded data
TCs_CMA.binning()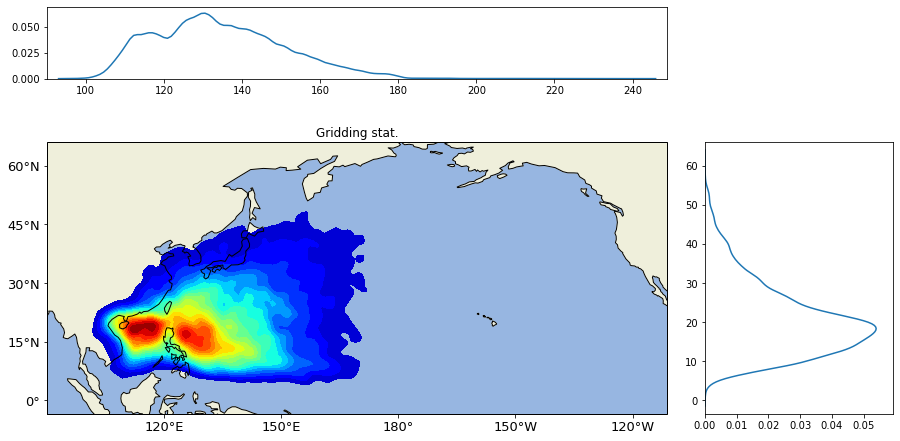
Manipulating a single TC is also simple:
# Selecting a single TC
tc = TCs_cma[-1]

# Briefly descibe the TC
print(tc)

# Plot the TC track and intensity
tc.plot()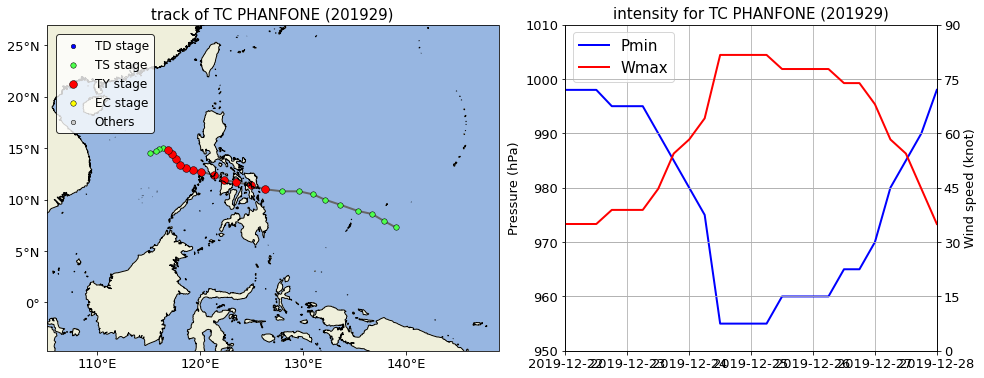
TCSet also supports statistical analysis over time space. One can plot the timeseries of TC number and accumulated cyclonic energy (ACE) of a TCSet as:
# plot the climatological timeseries of No. and ACE
TCs_CMA.plot_timeseries(freq='annual')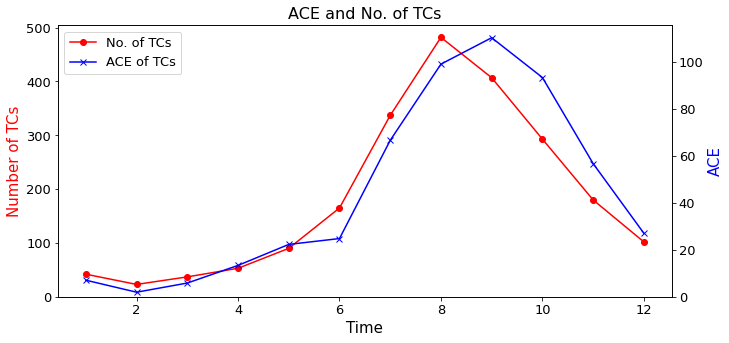
More examples can be found at this notebook