The purpose of this project is to create a station for monitoring the environmental conditions for home. The device will be open source and based on Arduino and NodeMCU.
- Environmental conditions measurement unit
- Why
- Project
- Future implementations
- Other project
- Contributors
- References
- DHT11 / DHT22 / DHT12
- ESP32
- ESP8266
- Raspberry Pi
- DS18B20
- 4.7k Ohm Resistor
Thermal comfort is the condition of mind that expresses satisfaction with the thermal environment. The human body can be viewed as a heat engine where food is the input energy. The human body will release excess heat into the environment and the heat transfer is proportional to temperature difference. Both the hot and cold scenarios lead to discomfort.
Sever study show how negative health and well-being outcomes associated with increasing frequency of heat stress interfering with daily activities.
The main factors that influence thermal comfort are those that determine heat gain and loss, namely metabolic rate, clothing insulation, air temperature, mean radiant temperature, air speed and relative humidity. Psychological parameters, such as individual expectations, also affect thermal comfort. The thermal comfort temperature may vary greatly between individuals and depending on factors such as activity level, clothing, and humidity.

From Wikipedia - This psychrometric chart represents the acceptable combination of air temperature and humidity values, according to the PMV/PPD method in the ASHRAE 55-2010 Standard. The comfort zone in blue represents the 90% of acceptability,
Generally, humans do not perform well under thermal stress with performances lower than their performance at normal thermal wet conditions. Some of the physiological effects of thermal heat stress include increased blood flow to the skin, sweating, and increased ventilation.
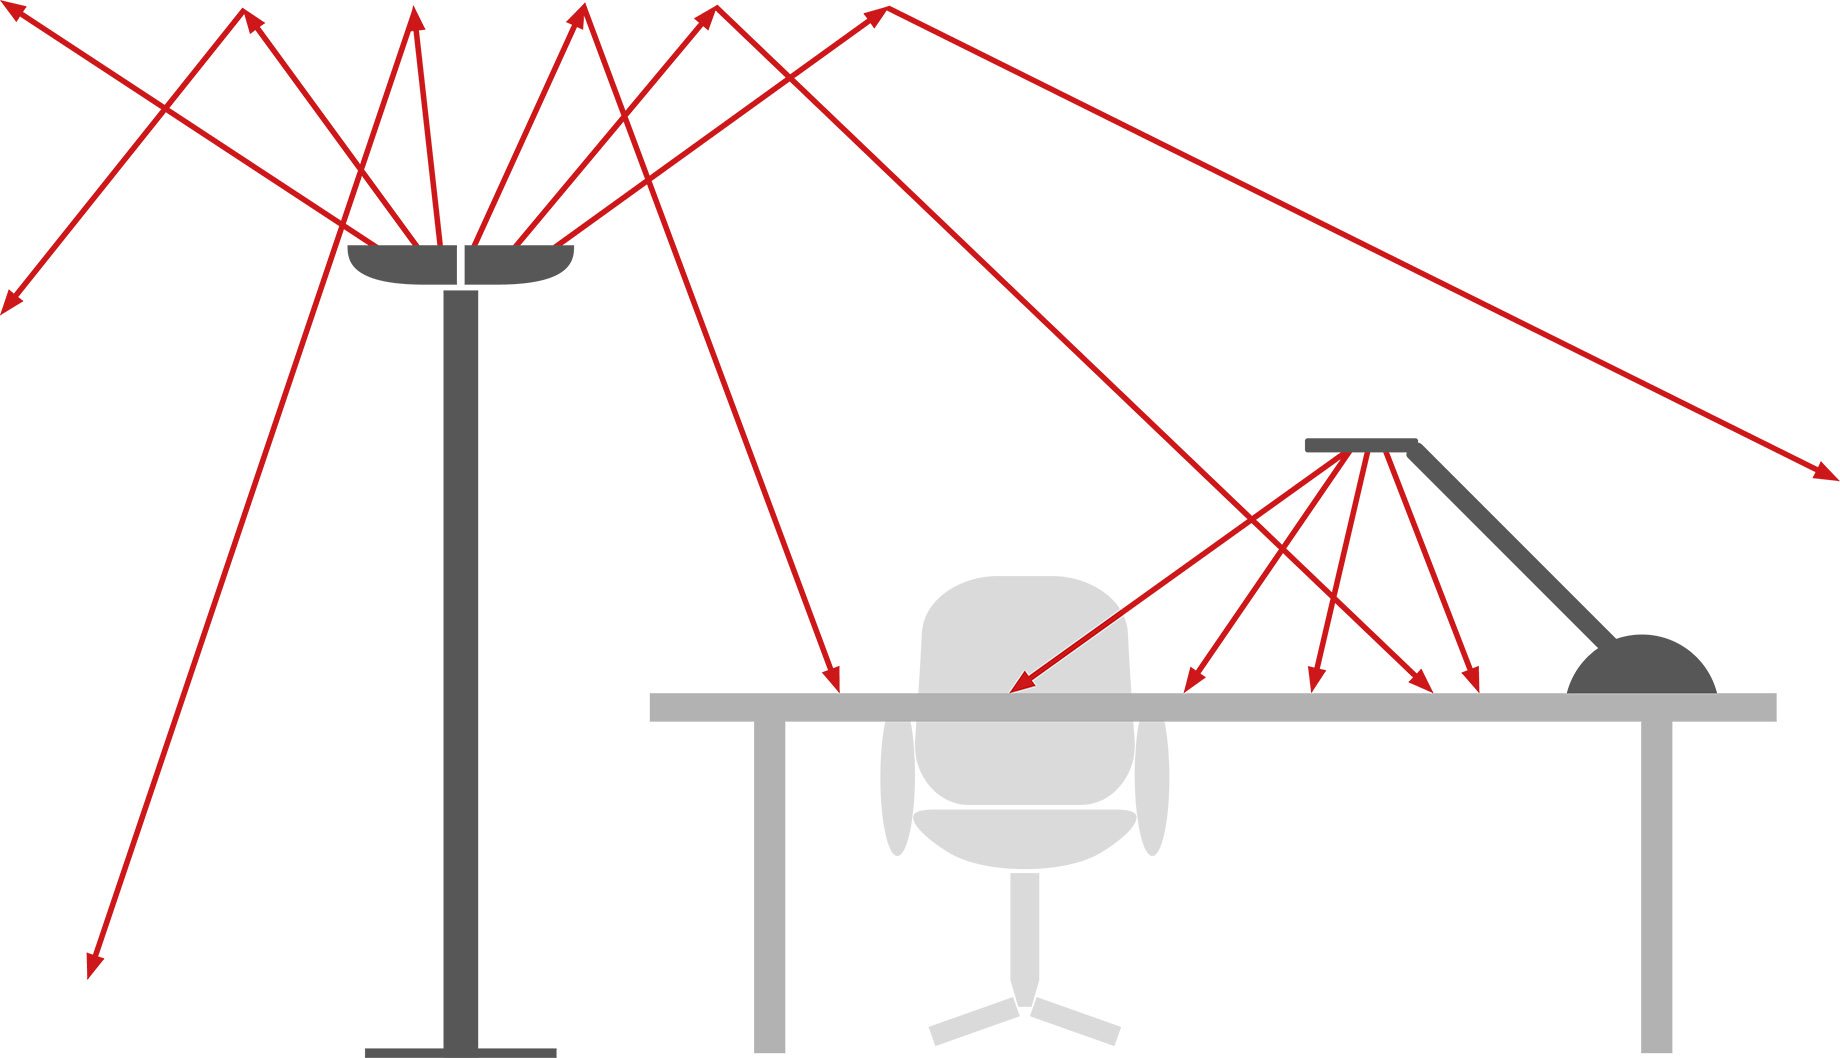
People receive about 85 percent of their information through their sense of sight. Appropriate lighting, without glare or shadows, can reduce eye fatigue and headaches; it can prevent workplace incidents by increasing the visibility of moving machinery and other safety hazards. Good quality lighting also reduces the chance of incidents and injuries from "momentary blindness" (momentary low field vision due to eyes adjusting from brighter to darker, or vice-versa, surroundings).
The ability to "see" at work depends not only on lighting but also on:
- The time to focus on an object. Fast moving objects are hard to see.
- The size of an object. Very small objects are hard to see.
- Brightness. Too much or too little reflected light makes objects hard to see.
- Contrast between an object and its immediate background. Too little contrast makes it hard to distinguish an object from the background.
Light sources can be divided between natural light and electrical sources. In the case of electric light sources, different types of light bulbs can produce different effects. The effects range from the warmth of light to energy efficiency to the effect on eyesight to the colour rendering.
Not enough light can also be a problem so even in workplaces where daylight is available, it is essential to have a good electric lighting system.
There are three basic types of lighting:
- General.
- Localized-general
- Local (or task).

Eye discomfort is a general term which can include some or many symptoms. It may be part of “computer vision syndrome” which includes: eyestrain, dry eyes, blurred vision, red or pink eyes, burning, light sensitivity, headaches, and pain in the shoulders, neck and back. Eye discomfort symptoms may be caused by: poor lighting, glare on a computer or tablet screen, poor quality computer or tablet screen (e.g., poor resolution, blurry image, etc.), improper viewing distances, poor seating posture, uncorrected vision problems, dry air, air movement, or a combination of these factors.
The recommended range of illuminations varies in different task. From simple orientation 100-500 Lux (lumens for square inches), to visual tasks of medium contrast or small size 700-1200 Lux, to visual tasks of low contrast and very small size over a prolonged period 2000-5000 Lux.
It is also important to valuate reflectance of object, glare and reflectance.
Indoor air quality (IAQ) problems result from interactions between building materials and furnishing, activities within the building, climate, and building occupants. IAQ problems may arise from one or more of the following causes:
- Indoor environment - inadequate temperature, humidity, poor air circulation, ventilation system issues.
- Indoor air contaminants - chemicals, dusts, moulds or fungi, bacteria, gases, vapours, odours.
- Insufficient outdoor air intake.


The project is divided into several phases. After the fist stage of sensor testing and related library studies the idea is to use a local web server (on the ESP32) to read the data from LAN. This will also help analyze the ideal position to put the sensory box. The web server is an asynchronous web server built using the ESPAsyncWebServer library so the sensor reading is update automatically without the need to refresh the web page.
The third phase consists to allowing alexa to read temperature with Sinric. This will also allow us to control EPS32 outputs through Alexa vocal commands.
Sinric permit a fists remote reading and logging for sensors data but only for temperature, humidity, air quality and energy consumption.

The most important step is to create a LAMP web server on Raspberry Pi and to use it to publish data. This also allows us to integrate several EPS32s (e.g. for different rooms) into a single web server.
In the following image the block diagram for final configurations:

To avoid overloading the LAN network, a radio communication system between raspberry and ESP32 could be developed. Or a radio link could be created between two ESP32s (or any other board similar to Arduino).
Finally all the sensors and the relative esp32 will be soldered on a board and the project will be enclosed in a 3d printed case. It is not excluded that the project will also be transferred to a customized pcb.
A last possibility is to open the firewall ports and allow access to the webserver remotely.
Another options is to have a domain name and hosting account that allows to store sensor readings from the ESP32 or ESP8266. It's possible to visualize the readings from anywhere in the world by accessing your own server domain.

For general sensor reading search in example folder
In this case a wemos D32 is used. To use it with Arduino IDE instal ESP8266 Library and select NodeMCU 1 (ESP-12E) board. It is also important to install CH340G driver. Use this link esp8266 package to add board manager and after install esp8266.

Circuit diagram

To read DHT11 is used DTH library from Adafruit. Frist include library and define pin
#include "DHT.h"
#define DHTTYPE DHT11
DHT dht(DHTPIN, DHTTYPE);
// Reading temperature or humidity takes about 250 milliseconds!
// Sensor readings may also be up to 2 seconds 'old' (its a very slow sensor)
float h = dht.readHumidity();
// Read temperature as Celsius (the default)
float t = dht.readTemperature();
Define variables and print it with:
Serial.print(h)
Serial.print(t)
For other info DHT11 Reading Example
The web server can be accessed with any device that has a browser on your local network. This is an asynchronous web server that update data automatically without need to refresh the web page and with custom CSS to style the web page.
Complete description in: ESP8266 Web Server Extra

DS18B20 hand held to see temperature difference
Install the DHT library by Adafruit.
Follow the next step to install the ESPAsyncWebServer library:
- Download AsyncWebServer library
- Unzip the .zip folder
- Rename your folder from
ESPAsyncWebServer-masterto ESPAsyncWebServer - Move the ESPAsyncWebServer folder to your Arduino IDE installation libraries folder
Follow the next step to install the ESPAsync TCP Library:
- Download ESPAsync TCP library
- Unzip
- Rename your folder from
ESPAsyncTCP-masterto ESPAsyncTCP - Move the ESPAsyncTCP folder to your Arduino IDE installation libraries folder Restard Arduino IDE.
The example code is presented in esp8266 example folder
Insert wifi credentials!
const char* ssid = "REPLACE_WITH_YOUR_SSID";
const char* password = "REPLACE_WITH_YOUR_PASSWORD";
The webpage include heading and differents paragraph to display sensor data.There are also two icons to style the page.
All the HTML text with styles included is stored in the index_html variable. Now we’ll go through the HTML text and see what each part does.
<p>
  <i class="fas fa-thermometer-half" style="color:#059e8a;"</i>
  <span class="dht-labels">Temperature</span>
  <span id="temperature">%TEMPERATURE%</span>
  <sup class="units">°C</sup>
</p>
For automatic updates ther's some JavaScript code in our web page that updates the temperature and humidity automatically, every 10 seconds. Scripts in HTML text should go between the <script></script> tags.
Example for temperature:
<script>
setInterval(function ( ) {
  var xhttp = new XMLHttpRequest();
  xhttp.onreadystatechange = function() {
    if (this.readyState == 4 && this.status == 200) {
      document.getElementById("temperature").innerHTML = this.responseText;
    }
  };
  xhttp.open("GET", "/temperature", true);
  xhttp.send();
}, 10000 ) ;
To update data on the background, there is a setInterval() function that runs every 10 seconds.
Basically, it makes a request in the /data URL to get the latest data:
  xhttp.open("GET", "/data", true);
  xhttp.send();
}, 10000 ) ;
When it receives that value, it updates the HTML element whose id is data.
if (this.readyState == 4 && this.status == 200) {
  document.getElementById("temperature").innerHTML = this.responseText;
}
Another important function is processor() function, that will replace the placeholders in our HTML text with the actual temperature and humidity values.
String processor(const String& var){
  //Serial.println(var);
  if(var == "TEMPERATURE"){
    return String(t);
  }
  else if(var == "DATA"){
    return String(data);
  }
  return String();
}
When the web page is requested, we check if the HTML has any placeholders. If it finds the %DATA% placeholder, we return the temperature that is stored on the data variable.
In setup() there are different initializations.
Connection to your local network and print the ESP8266 IP address:
WiFi.begin(ssid, password);
while (WiFi.status() != WL_CONNECTED) {
  delay(1000);
  Serial.println("Connecting to WiFi..");
}
And the code to handle the web server.
When we make a request on the root URL, we send the HTML text that is stored on the index_html variable. We also need to pass the processor function, that will replace all the placeholders with the right values.
server.on("/", HTTP_GET, [](AsyncWebServerRequest *request){
  request->send_P(200, "text/html", index_html, processor);
});
Add additional handlers to update the temperature and humidity readings. When we receive a request on the /data URL, we simply need to send the updated temperature value. It is plain text, and it should be sent as a char, so, we use the c_str() method.
server.on("/data", HTTP_GET, [](AsyncWebServerRequest *request){
  request->send_P(200, "text/plain", String(data).c_str());
});
Start webserver
server.begin();It is recommended to print the sensor data on the serial monitor through the loop() for a debug function.
Create variabile for data reading and update it in loop()
float data = 0;Ad paragraph and placeholder into HTML section:
<p>
<i class="fas fa-temperature-high" style="color:#b32d00;"></i>
<span class="dht-labels">Data</span>
<span id="dataid">%DATA%</span>
<sup class="units">°C</sup>
</p>Ad section into <script> block for the placeholder:
setInterval(function ( ) {
  var xhttp = new XMLHttpRequest();
  xhttp.onreadystatechange = function() {
    if (this.readyState == 4 && this.status == 200) {
      document.getElementById("dataid").innerHTML = this.responseText;
    }
  };
  xhttp.open("GET", "/data", true);
  xhttp.send();
}, 10000) ;
Ad else if section into processor():
else if (var == "DATA") { // DHT humidity
    return String(data);
  }
Another options is to obtain sensor data with a specially created function and update it in this last section taking its data as a string. Suppose this function called specialfunction() this last paragraph would be:
else if (var == "DATA") { // DHT humidity
    return String(specialfunction());
  }
For other info to ESP8266 Web Server Extra
Thanks to Rui Santos. For other information and code comments DHT11 ESP8266 Web Server
Install library for DS18B20: install OneWire from library manager. Install Dallas Temperature library by Miles Burton from library manager.
Include library and define pin:
#include <OneWire.h>
#include <DallasTemperature.h>
// GPIO where the DS18B20 is connected to
const int oneWireBus = D5;
Setup comincation:
OneWire oneWire(oneWireBus);
DallasTemperature sensors(&oneWire);
In the setup() section start sensors and serial.
Request temperature with:
sensors.requestTemperatures();
float temperatureC = sensors.getTempCByIndex(0);
For other info DS18B20 Reading Exampe

Real application - Prototype no. 6 - Temperature and humidity sensor used in a domestic environment by placing inside an electrical junction box, leaving the sensor exposed to ambient air.

The section for ESP 32 will be updated soon.
For integration with Alexa we will use the functions offered by Sinric Pro.
Sinric pro is a very practical platform that allows us to connect the development board to Alexa and Google Home. The first step is to create an account on Sinric Pro.
For the wifi connection, DHT reading and calbe connection we use the same web server procedure indicated above.
Install and include library and dependencies for SinricPro:
#include <SinricPro.h>
#include "SinricProTemperaturesensor.h"
Define the following constants available from the web page of your Sinric account:
#define APP_KEY           "YOUR-APP-KEY"
#define APP_SECRET        "YOUR-APP-SECRET"
#define TEMP_SENSOR_ID    "YOUR-DEVICE-ID"
bool deviceIsOn;                              // Temeprature sensor on/off state
float lastTemperature;                        // last known temperature (for compare)
float lastHumidity;                           // last known humidity (for compare)
#define EVENT_WAIT_TIME   60000               // send event every 60 seconds
unsigned long lastEvent = (-EVENT_WAIT_TIME); // last time event has been sent
There are other important function like onPowerState() that callback for setPowerState request parameters and return true if request should be marked as handled correctly / false if not. The handleTemperatatureSensor() that checks if Temperaturesensor is turned on, get actual temperature and humidity and check if these values are valid and send event to SinricPro Server if temperature or humidity changed. The setupSinricPro() to inizialize Sinric comunciation.
So they look like:
bool onPowerState(const String &deviceId, bool &state) {
  Serial.printf("Temperaturesensor turned %s (via SinricPro) \r\n", state ? "on" : "off");
  deviceIsOn = state; // turn on / off temperature sensor
  return true; // request handled properly
}

void handleTemperaturesensor() {
  if (deviceIsOn == false) return; // device is off...do nothing

  unsigned long actualMillis = millis();
  if (actualMillis - lastEvent < EVENT_WAIT_TIME) return; //only check every EVENT_WAIT_TIME milliseconds

  t = dht.readTemperature();          // get actual temperature in °C
  //  temperature = dht.getTemperature() * 1.8f + 32;  // get actual temperature in °F
  h = dht.readHumidity();                // get actual humidity

  if (isnan(t) || isnan(h)) { // reading failed...
    Serial.printf("DHT reading failed!\r\n");  // print error message
    return;                                    // try again next time
  }

  if (t == lastTemperature || h == lastHumidity) return; // if no values changed do nothing...

  SinricProTemperaturesensor &mySensor = SinricPro[TEMP_SENSOR_ID];  // get temperaturesensor device

  bool success = mySensor.sendTemperatureEvent(t, h); // send event
  if (success) {  // if event was sent successfuly, print temperature and humidity to serial
    Serial.printf("Temperature: %2.1f Celsius\tHumidity: %2.1f%%\r\n", t, h);
  } else {  // if sending event failed, print error message
    Serial.printf("Something went wrong...could not send Event to server!\r\n");
  }

  lastTemperature = t;  // save actual temperature for next compare
  lastHumidity = h;        // save actual humidity for next compare
  lastEvent = actualMillis;       // save actual time for next compare
}


// setup function for SinricPro
void setupSinricPro() {
  // add device to SinricPro
  SinricProTemperaturesensor &mySensor = SinricPro[TEMP_SENSOR_ID];
  mySensor.onPowerState(onPowerState);

  // setup SinricPro
  SinricPro.onConnected([]() {
    Serial.printf("Connected to SinricPro\r\n");
  });
  SinricPro.onDisconnected([]() {
    Serial.printf("Disconnected from SinricPro\r\n");
  });
  SinricPro.begin(APP_KEY, APP_SECRET);
  SinricPro.restoreDeviceStates(true); // get latest known deviceState from server (is device turned on?)
}
Include in setup() the setupSinricPro() function.
Call in loop() the function:
  SinricPro.handle();
handleTemperaturesensor(); It's possibile to add Sinric Pro skills in Alexa app and login with Sinric credential to add device.

It's possibile to download the Sinric Pro App or to login into SinricPro website to visualize sensor data log for different time period.

Other information and complete sketch in esp8266 sinric example folder
This code will be integrated with that of the web server.
The following has been taken from ESP32/ESP8266 Publish Data to Raspberry Pi LAMP Server and not yet revised

This section has not been detailed see private domain server for better content.
After installing a LAMP server and phpMyAdmin on Raspberry Pi, you can login into phpMyAdmin. After that, follow the next steps to create your database and SQL table.
Open your browser and type http://Your-Raspberry-Pi-IP-Address/phpmyadmin, your should see the login page for phpMyAdmin web interface.
Create Database
Select the “Databases” menu at the top, complete the “Create database” fields:
- esp_data
- utf8mb4_general_ci
Then, press the Create button:
That’s it! Your new database was created successfully. Now, save your database name because you’ll need it later:
- Database name:
esp_data
Creating a SQL table
After creating your database, in the left sidebar select your database name esp_data:
Raspberry Pi phpMyAdmin open new database
Important: make sure you’ve opened the
esp_datadatabase. Then, click the SQL tab. If you don’t follow these exact steps and run the SQL query, you might create a table in the wrong database.
Copy the SQL query in the following snippet:
CREATE TABLE SensorData (
    id INT(6) UNSIGNED AUTO_INCREMENT PRIMARY KEY,
    sensor VARCHAR(30) NOT NULL,
    location VARCHAR(30) NOT NULL,
    value1 VARCHAR(10),
    value2 VARCHAR(10),
    value3 VARCHAR(10),
    reading_time TIMESTAMP DEFAULT CURRENT_TIMESTAMP ON UPDATE CURRENT_TIMESTAMP
)
Open the “SQL” tab, paste it in the SQL query field (highlighted with a red rectangle) and press the Go button to create your table:
Raspberry Pi phpMyAdmin run SQL table created.
After that, you should see your newly created table called SensorData in the esp_data database.
Raspberry Pi phpMyAdmin table created empty
In this section, we’re going to create a PHP script that is responsible for receiving incoming requests from the ESP32 or ESP8266 and inserting the data into a MySQL database.
You can either run the next commands on a Raspberry Pi set as a desktop computer or using an SSH connection.
If you’re connected to your Raspberry Pi with an SSH connection, type the next command to create a file in /var/www/html directory:
pi@raspberrypi:~ $ nano /var/www/html/post-esp-data.php
Note: if you’re following this tutorial and you’re not familiar with PHP or MySQL, I recommend creating these exact files. Otherwise, you’ll need to modify the ESP sketch provided with different URL paths.
Copy the following PHP script to the newly created file (post-esp-data.php):
<?php

/*
  Rui Santos
  Complete project details at https://RandomNerdTutorials.com/esp32-esp8266-mysql-database-php/

  Permission is hereby granted, free of charge, to any person obtaining a copy
  of this software and associated documentation files.

  The above copyright notice and this permission notice shall be included in all
  copies or substantial portions of the Software.
*/

$servername = "localhost";

// REPLACE with your Database name
$dbname = "REPLACE_WITH_YOUR_DATABASE_NAME";
// REPLACE with Database user
$username = "REPLACE_WITH_YOUR_USERNAME";
// REPLACE with Database user password
$password = "REPLACE_WITH_YOUR_PASSWORD";

// Keep this API Key value to be compatible with the ESP32 code provided in the project page.
// If you change this value, the ESP32 sketch needs to match
$api_key_value = "tPmAT5Ab3j7F9";

$api_key= $sensor = $location = $value1 = $value2 = $value3 = "";

if ($_SERVER["REQUEST_METHOD"] == "POST") {
    $api_key = test_input($_POST["api_key"]);
    if($api_key == $api_key_value) {
        $sensor = test_input($_POST["sensor"]);
        $location = test_input($_POST["location"]);
        $value1 = test_input($_POST["value1"]);
        $value2 = test_input($_POST["value2"]);
        $value3 = test_input($_POST["value3"]);

        // Create connection
        $conn = new mysqli($servername, $username, $password, $dbname);
        // Check connection
        if ($conn->connect_error) {
            die("Connection failed: " . $conn->connect_error);
        }

        $sql = "INSERT INTO SensorData (sensor, location, value1, value2, value3)
        VALUES ('" . $sensor . "', '" . $location . "', '" . $value1 . "', '" . $value2 . "', '" . $value3 . "')";

        if ($conn->query($sql) === TRUE) {
            echo "New record created successfully";
        }
        else {
            echo "Error: " . $sql . "<br>" . $conn->error;
        }

        $conn->close();
    }
    else {
        echo "Wrong API Key provided.";
    }

}
else {
    echo "No data posted with HTTP POST.";
}

function test_input($data) {
    $data = trim($data);
    $data = stripslashes($data);
    $data = htmlspecialchars($data);
    return $data;
}
Before saving the file, you need to modify the $dbname, $username and $password variables with your unique details:
// Your Database name
$dbname = "esp_data";
// Your Database user
$username = "root";
// Your Database user password
$password = "YOUR_USER_PASSWORD";
After adding the database name, username and password, save the file (Ctrl+X, y, and Enter key) and continue with this tutorial.
### PHP Script – Display Database Content
Create another PHP file in the /var/www/html directory that will display all the database content in a web page. Name your new file: esp-data.php
pi@raspberrypi:~ $ nano /var/www/html/esp-data.php
Edit the newly created file (esp-data.php) and copy the following PHP script:
<!DOCTYPE html>
<html><body>
<?php
/*
  Rui Santos
  Complete project details at https://RandomNerdTutorials.com/esp32-esp8266-mysql-database-php/

  Permission is hereby granted, free of charge, to any person obtaining a copy
  of this software and associated documentation files.

  The above copyright notice and this permission notice shall be included in all
  copies or substantial portions of the Software.
*/

$servername = "localhost";

// REPLACE with your Database name
$dbname = "REPLACE_WITH_YOUR_DATABASE_NAME";
// REPLACE with Database user
$username = "REPLACE_WITH_YOUR_USERNAME";
// REPLACE with Database user password
$password = "REPLACE_WITH_YOUR_PASSWORD";

// Create connection
$conn = new mysqli($servername, $username, $password, $dbname);
// Check connection
if ($conn->connect_error) {
    die("Connection failed: " . $conn->connect_error);
}

$sql = "SELECT id, sensor, location, value1, value2, value3, reading_time FROM SensorData ORDER BY id DESC";

echo '<table cellspacing="5" cellpadding="5">
      <tr>
        <td>ID</td>
        <td>Sensor</td>
        <td>Location</td>
        <td>Value 1</td>
        <td>Value 2</td>
        <td>Value 3</td>
        <td>Timestamp</td>
      </tr>';

if ($result = $conn->query($sql)) {
    while ($row = $result->fetch_assoc()) {
        $row_id = $row["id"];
        $row_sensor = $row["sensor"];
        $row_location = $row["location"];
        $row_value1 = $row["value1"];
        $row_value2 = $row["value2"];
        $row_value3 = $row["value3"];
        $row_reading_time = $row["reading_time"];
        // Uncomment to set timezone to - 1 hour (you can change 1 to any number)
        //$row_reading_time = date("Y-m-d H:i:s", strtotime("$row_reading_time - 1 hours"));

        // Uncomment to set timezone to + 4 hours (you can change 4 to any number)
        //$row_reading_time = date("Y-m-d H:i:s", strtotime("$row_reading_time + 4 hours"));

        echo '<tr>
                <td>' . $row_id . '</td>
                <td>' . $row_sensor . '</td>
                <td>' . $row_location . '</td>
                <td>' . $row_value1 . '</td>
                <td>' . $row_value2 . '</td>
                <td>' . $row_value3 . '</td>
                <td>' . $row_reading_time . '</td>
              </tr>';
    }
    $result->free();
}

$conn->close();
?>
</table>
</body>
</html>
Add the $dbname, $username and $password:
// Your Database name
$dbname = "esp_data";
// Your Database user
$username = "root";
// Your Database user password
$password = "YOUR_USER_PASSWORD";
Save the file (Ctrl+X, y, and Enter key) and continue with this project.
If you try to access your Raspberry Pi IP Address in the following URL path:
http://Your-Raspberry-Pi-IP-Address/esp-data.php
That’s it! If you see that empty table printed in your browser, it means that everything is ready. In the next section, you’ll learn how to insert data from your ESP32 or ESP8266 into the database.
We’ll program the ESP32/ESP8266 using Arduino IDE, so you must have the ESP32/ESP8266 add-on installed in your Arduino IDE. Follow one of the next tutorials depending on the board you’re using:
- Install the ESP32 Board in Arduino IDE
- Install the ESP8266 Board in Arduino IDE
After installing the necessary board add-ons, copy the following code to your Arduino IDE, but don’t upload it yet. You need to make some changes to make it work for you.
Setting network credentials how indicated in webserver section.
Setting your serverName
You also need to type your Raspberry Pi IP address, so the ESP publishes the readings to your LAMP server.
const char* serverName = "http://Your-Raspberry-Pi-IP-Address/post-esp-data.php";For example:
const char* serverName = "http://192.168.1.86/post-esp-data.php";Now, you can upload the code to your board. It should work straight away both in the ESP32 or ESP8266 board. If you want to learn how the code works, read the next section.
How the code works
This project is already quite long, so we won’t cover in detail how the code works, but here’s a quick summary:
- Import all the libraries to make it work (it will import either the
ESP32orESP8266libraries based on the selected board in your Arduino IDE) - Set variables that you might want to change (
apiKeyValue,sensorName,sensorLocation) - The
apiKeyValueis just a random string that you can modify. It’s used for security reasons, so only anyone that knows your API key can publish data to your database - Initialize the serial communication for debugging purposes
- Establish a Wi-Fi connection with your router
- Initialize the BME280 to get readings
Then, in the loop() is where you actually make the HTTP POST request every 30 seconds with the latest sensor readings:
// Your Domain name with URL path or IP address with path
http.begin(serverName);

// Specify content-type header
http.addHeader("Content-Type", "application/x-www-form-urlencoded");

// Prepare your HTTP POST request data
String httpRequestData = "api_key=" + apiKeyValue + "&sensor=" + sensorName                      + "&location=" + sensorLocation + "&value1=" + String(bme.readTemperature())                      + "&value2=" + String(bme.readHumidity()) + "&value3=" + String(bme.readPressure()/100.0F) + "";

int httpResponseCode = http.POST(httpRequestData);
You can comment the httpRequestData variable above that concatenates all the sensors readings and use the httpRequestData variable below for testing purposes:
String httpRequestData = "api_key=tPmAT5Ab3j7F9&sensor=BME280&location=Office&value1=24.75&value2=49.54&value3=1005.14";After completing all the steps, let your ESP board collect some readings and publish them to your server.
For other information randomnertutorials.com
The goal of this section is to have your own domain name and hosting account that allows you to store sensor readings from the ESP32 or ESP8266. You can visualize the readings from anywhere in the world by accessing your own server domain.
In this guide is used Siteground hosting.
After signing up for a hosting account and setting up a domain name, you can login to your cPanel or similar dashboard. After that, follow the next steps to create your database, username, password and SQL table.
In my case, the database name is assigned by siteground. Save it.

Add an user username and set a password. You must save all those details, because you’ll need them later to establish a database connection with your PHP code.

Set the user to the database:

That’s it! Your new database and user were created successfully. Now, save all your details because you’ll need them later:
- Database name:
example_esp_data - Username:
example_esp_board - Password:
your password
After creating your database and user, go back to cPanel dashboard and search for “phpMyAdmin”.
In the left sidebar, select your database name example_esp_data and open the “SQL” tab
Important: make sure you’ve opened the
example_esp_datadatabase. Then, click the SQL tab. If you don’t follow these exact steps and run the SQL query, you might create a table in the wrong database.
Copy the SQL query in the following snippet:
CREATE TABLE Sensor (
    id INT(6) UNSIGNED AUTO_INCREMENT PRIMARY KEY,
    value1 VARCHAR(10),
    value2 VARCHAR(10),
    value3 VARCHAR(10),
    reading_time TIMESTAMP DEFAULT CURRENT_TIMESTAMP ON UPDATE CURRENT_TIMESTAMP
)
After that, you should see your newly created table called Sensor in the example_esp_data database as shown in the figure below:
In this section, we’re going to create a PHP script that receives incoming requests from the ESP32 or ESP8266 and inserts the data into a MySQL database.
If you’re using a hosting provider with cPanel, you can search for “File Manager”.
Then, select the public_html option and press the “+ File” button to create a new .php file.
Note: if you’re following this tutorial and you’re not familiar with PHP or MySQL, I recommend creating these exact files. Otherwise, you’ll need to modify the ESP sketch provided with different URL paths.
Create a new file in /public_html with this exact name and extension: post-data.php
PHP Create New file post data .php Edit the newly created file (post-data.php) and copy the following snippet:
<?php
/*
  Thanks to Rui Santos
  Permission is hereby granted, free of charge, to any person obtaining a copy of this software and associated documentation files.The above copyright notice and this permission notice shall be included in all copies or substantial portions of the Software.
*/

$servername = "localhost";

// REPLACE with your Database name
$dbname = "REPLACE_WITH_YOUR_DATABASE_NAME";
// REPLACE with Database user
$username = "REPLACE_WITH_YOUR_USERNAME";
// REPLACE with Database user password
$password = "REPLACE_WITH_YOUR_PASSWORD";

// Keep this API Key value to be compatible with the ESP32 code provided in the project page. If you change this value, the ESP32 sketch needs to match
$api_key_value = "tPmAT5Ab3j7F8";

$api_key = $value1 = $value2 = $value3 = "";

if ($_SERVER["REQUEST_METHOD"] == "POST") {
    $api_key = test_input($_POST["api_key"]);
    if($api_key == $api_key_value) {
        $value1 = test_input($_POST["value1"]);
        $value2 = test_input($_POST["value2"]);
        $value3 = test_input($_POST["value3"]);

        // Create connection
        $conn = new mysqli($servername, $username, $password, $dbname);
        // Check connection
        if ($conn->connect_error) {
            die("Connection failed: " . $conn->connect_error);
        }

        $sql = "INSERT INTO Sensor (value1, value2, value3)
        VALUES ('" . $value1 . "', '" . $value2 . "', '" . $value3 . "')";

        if ($conn->query($sql) === TRUE) {
            echo "New record created successfully";
        }
        else {
            echo "Error: " . $sql . "<br>" . $conn->error;
        }

        $conn->close();
    }
    else {
        echo "Wrong API Key provided.";
    }

}
else {
    echo "No data posted with HTTP POST.";
}

function test_input($data) {
    $data = trim($data);
    $data = stripslashes($data);
    $data = htmlspecialchars($data);
    return $data;
}
Before saving the file, you need to modify the $dbname, $username and $password variables with your unique details:
// Your Database name
$dbname = "example_esp_data";
// Your Database user
$username = "example_esp_board";
// Your Database user password
$password = "YOUR_USER_PASSWORD";
After adding the database name, username and password, save the file and continue with this tutorial. If you try to access your domain name in the next URL path.
http://example.com/post-data.php
Create another PHP file in the /public_html directory that will plot the database content in a chart on a web page. Name your new file: esp-chart.php
Edit the newly created file (esp-chart.php) and copy the following code:
<!--
  Thanks to Rui Santos
  -->
<?php

$servername = "localhost";

// REPLACE with your Database name
$dbname = "REPLACE_WITH_YOUR_DATABASE_NAME";
// REPLACE with Database user
$username = "REPLACE_WITH_YOUR_USERNAME";
// REPLACE with Database user password
$password = "REPLACE_WITH_YOUR_PASSWORD";

// Create connection
$conn = new mysqli($servername, $username, $password, $dbname);
// Check connection
if ($conn->connect_error) {
    die("Connection failed: " . $conn->connect_error);
}

$sql = "SELECT id, value1, value2, value3, reading_time FROM Sensor order by reading_time desc limit 40";

$result = $conn->query($sql);

while ($data = $result->fetch_assoc()){
    $sensor_data[] = $data;
}

$readings_time = array_column($sensor_data, 'reading_time');

// ******* Uncomment to convert readings time array to your timezone ********
/*$i = 0;
foreach ($readings_time as $reading){
    // Uncomment to set timezone to - 1 hour (you can change 1 to any number)
    $readings_time[$i] = date("Y-m-d H:i:s", strtotime("$reading - 1 hours"));
    // Uncomment to set timezone to + 4 hours (you can change 4 to any number)
    //$readings_time[$i] = date("Y-m-d H:i:s", strtotime("$reading + 4 hours"));
    $i += 1;
}*/

$value1 = json_encode(array_reverse(array_column($sensor_data, 'value1')), JSON_NUMERIC_CHECK);
$value2 = json_encode(array_reverse(array_column($sensor_data, 'value2')), JSON_NUMERIC_CHECK);
$value3 = json_encode(array_reverse(array_column($sensor_data, 'value3')), JSON_NUMERIC_CHECK);
$reading_time = json_encode(array_reverse($readings_time), JSON_NUMERIC_CHECK);

/*echo $value1;
echo $value2;
echo $value3;
echo $reading_time;*/

$result->free();
$conn->close();
?>

<!DOCTYPE html>
<html>
<meta name="viewport" content="width=device-width, initial-scale=1">
  <script src="https://code.highcharts.com/highcharts.js"></script>
  <style>
    body {
      min-width: 310px;
    	max-width: 1280px;
    	height: 500px;
      margin: 0 auto;
    }
    h2 {
      font-family: Arial;
      font-size: 2.5rem;
      text-align: center;
    }
  </style>
  <body>
    <h2>TEMPCONTROL</h2>
    <div id="chart-temperature" class="container"></div>
    <div id="chart-humidity" class="container"></div>
    <div id="chart-pressure" class="container"></div>
<script>

var value1 = <?php echo $value1; ?>;
var value2 = <?php echo $value2; ?>;
var value3 = <?php echo $value3; ?>;
var reading_time = <?php echo $reading_time; ?>;

var chartT = new Highcharts.Chart({
  chart:{ renderTo : 'chart-temperature' },
  title: { text: 'Temperature' },
  series: [{
    showInLegend: false,
    data: value1
  }],
  plotOptions: {
    line: { animation: false,
      dataLabels: { enabled: true }
    },
    series: { color: '#059e8a' }
  },
  xAxis: {
    type: 'datetime',
    categories: reading_time
  },
  yAxis: {
    title: { text: 'Temperature (Celsius)' }
    //title: { text: 'Temperature (Fahrenheit)' }
  },
  credits: { enabled: false }
});

var chartH = new Highcharts.Chart({
  chart:{ renderTo:'chart-humidity' },
  title: { text: 'Humidity' },
  series: [{
    showInLegend: false,
    data: value2
  }],
  plotOptions: {
    line: { animation: false,
      dataLabels: { enabled: true }
    }
  },
  xAxis: {
    type: 'datetime',
    //dateTimeLabelFormats: { second: '%H:%M:%S' },
    categories: reading_time
  },
  yAxis: {
    title: { text: 'Humidity (%)' }
  },
  credits: { enabled: false }
});


var chartP = new Highcharts.Chart({
  chart:{ renderTo:'chart-pressure' },
  title: { text: 'Pressure' },
  series: [{
    showInLegend: false,
    data: value3
  }],
  plotOptions: {
    line: { animation: false,
      dataLabels: { enabled: true }
    },
    series: { color: '#18009c' }
  },
  xAxis: {
    type: 'datetime',
    categories: reading_time
  },
  yAxis: {
    title: { text: 'Pressure (hPa)' }
  },
  credits: { enabled: false }
});

</script>
</body>
</html>
After adding the $dbname, $username and $password save the file and continue with this project.
// Your Database name
$dbname = "example_esp_data";
// Your Database user
$username = "example_esp_board";
// Your Database user password
$password = "YOUR_USER_PASSWORD";
For siteground user it is important to disable dynamic cache so add into .htaccesthe following snippet:
<IfModule mod_headers.c>
Header set Cache-Control "max-age=0,no-store"
</IfModule>
The file is locatel in /public_html directory.
if the file does not exist, create it.
Try to access your domain name in the following URL path:
http://example.com/esp-chart.php
That’s it! If you see three empty charts in your browser, it means that everything is ready. In the next section, you’ll learn how to publish your ESP32 or ESP8266 sensor readings.
To build the charts, we’ll use the Highcharts library. We’ll create three charts: temperature, humidity and pressure over time. The charts display a maximum of 400 data points, and a new reading is added every 5 minutes, but you change these values in your code.
This is only an example code, the basis for making everything work. The code is completely modular and will be customized and expanded
The same previous code is used with some additions:
Include new library:
#include <ESP8266HTTPClient.h>;Inizialize new variables:
// server mysql
// REPLACE with your Domain name and URL path or IP address with path
const char* serverName = "http://yourdomain.it/post-data.php";
// Keep this API Key value to be compatible with the PHP code provided in the project page.
// If you change the apiKeyValue value, the PHP file /post-data.php also needs to have the same key
String apiKeyValue = "tPmAT5Ab3j7F8";
//timer
unsigned long t2=0;
unsigned long dt=0;
unsigned long t3 = 300000;//update database every 5 minutes
Add this snippet in the loop()section:
//Check WiFi connection status
  if (WiFi.status() == WL_CONNECTED) {
    HTTPClient http;

    // Your Domain name with URL path or IP address with path
    http.begin(serverName);

    // Specify content-type header
    http.addHeader("Content-Type", "application/x-www-form-urlencoded");
    dt=millis()-t2;
    if (dt>= t3) {
      // Prepare your HTTP POST request data
      String httpRequestData = "api_key=" + apiKeyValue + "&value1=" + String(t)
                               + "&value2=" + String(h)  + "";
      Serial.print("httpRequestData: ");
      Serial.println(httpRequestData);

      if (httpResponseCode > 0) {
        Serial.print("HTTP Response code: ");
        Serial.println(httpResponseCode);
      }
      else {
        Serial.print("Error code: ");
        Serial.println(httpResponseCode);
      }
      t2=millis();
    }
    // Free resources
    http.end();
  }
Only
value1andvalue2are used in this code. Forvalue3see in the personalization section.
You need to make some changes to make it work for you.
Setting network credentials how indicated in webserver section.
Setting your serverName
You also need to type your domain name, so the ESP publishes the readings to your own server.
const char* serverName = "http://example.com/post-data.php";Now, you can upload the code to your board. It should work straight away both in the ESP32 or ESP8266 board. If you want to learn how the code works, read the next section.
How the code works
This project is already quite long, so we won’t cover in detail how the code works, but here’s a quick summary:
- Import all the libraries to make it work (it will import either the ESP32 or ESP8266 libraries based on the selected board in your Arduino IDE)
- Set variables that you might want to change (
apiKeyValue) - The
apiKeyValueis just a random string that you can modify. It’s used for security reasons, so only anyone that knows your API key can publish data to your database - Initialize the serial communication for debugging purposes
- Establish a Wi-Fi connection with your router
- Initialize the sensor to get readings
Then, in the loop() is where you actually make the HTTP POST request every 30 seconds with the latest BME280 readings:
// Your Domain name with URL path or IP address with path
http.begin(serverName);

// Specify content-type header
http.addHeader("Content-Type", "application/x-www-form-urlencoded");

// Prepare your HTTP POST request data
String httpRequestData = "api_key=" + apiKeyValue + "&value1="
                       + String(bme.readTemperature())
                       + "&value2=" + String(bme.readHumidity())
                       + "&value3=" + String(bme.readPressure()/100.0F) + "";

int httpResponseCode = http.POST(httpRequestData);After completing all the steps, let your ESP board collect some readings and publish them to your server.
If everything is correct, you should see data in Arduino IDE Serial Monitor.
If you open your domain name in this URL path:
http://example.com/esp-chart.php
You should see the all the readings stored in your database. Refresh the web page to see the latest readings:

You can also go to phpMyAdmin to manage the data stored in your Sensor table. You can delete it, edit, etc…
Thanks to randomnerdtutorials.com
Just load the same code and edit the following part in the loop() :
if (dt>= t3) {
      // Prepare your HTTP POST request data
      String httpRequestData = "api_key=" + apiKeyValue + "&value3=" + String(t)
                               + "&value4=" + String(h)  + "";
      Serial.print("httpRequestData: ");
      Serial.println(httpRequestData);

      if (httpResponseCode > 0) {
        Serial.print("HTTP Response code: ");
        Serial.println(httpResponseCode);
      }
      else {
        Serial.print("Error code: ");
        Serial.println(httpResponseCode);
      }
      t2=millis();
    }
    // Free resources
    http.end();
  }
Only for testing it is recommended to reduce t3 time to 3000 ms. After testing reset it to 300000 (5 minutes).
To add new column login in phpMyAdmin, go to the left sidebar and click the name of the database table you want to add a column to.
Click on Structureand there is aggiungi # campo.

Enter the number of columns and select location. Than click go.
Insert column detail:
- Name:
value4 - Type:
VARCHAR - Length/values:
10 - Collation:
utf8mb4_general_ci

Add value4 in the initial section:
$api_key = $value1 = $value2 = $value3 = $value4 = "";Add it in the if cycle:
if($api_key == $api_key_value) {
        $value1 = test_input($_POST["value1"]);
        $value2 = test_input($_POST["value2"]);
        $value3 = test_input($_POST["value3"]);
        $value4 = test_input($_POST["value4"]);

        // Create connection
        $conn = new mysqli($servername, $username, $password, $dbname);
        // Check connection
        if ($conn->connect_error) {
            die("Connection failed: " . $conn->connect_error);
        }

        $sql = "INSERT INTO Sensor (value1, value2, value3, value4)
        VALUES ('" . $value1 . "', '" . $value2 . "', '" . $value3 . "','" . $value4 . "')";

        if ($conn->query($sql) === TRUE) {
            echo "New record created successfully";
        }
        else {
            echo "Error: " . $sql . "<br>" . $conn->error;
        }

        $conn->close();
    }
Do it for all the extra values.
Before continue and add chart verify in phpMyAdmin that the table is correctly upgrade with new values.

In this screen there are no values for
value1andvalue2because they are set to update every 5 minutes instead ofvalue3andvalue4which update every 3 seconds. It is for testing purposes only.
To add new chart edit esp-chart.php.
-
Just add
value4in the section where is alsovalue1,value2andvalue4. -
Duplicate the
<div>container. -
Duplicate the Javscript section and set parameters.
Warning! Select a number of maximum values that are actually in the table otherwise the graph will give problems.
$sql = "SELECT id, value1, value2, value3, value4, reading_time FROM Sensor order by reading_time desc limit 400";Set a low number and increase progressively(otherwise check how many values there are from the table).

So the code look like this:
<?php

$servername = "localhost";

// REPLACE with your Database name
$dbname = "DATABASE_NAME";
// REPLACE with Database user
$username = "USER_NAME";
// REPLACE with Database user password
$password = "PASSWORD";

// Create connection
$conn = new mysqli($servername, $username, $password, $dbname);
// Check connection
if ($conn->connect_error) {
    die("Connection failed: " . $conn->connect_error);
}

$sql = "SELECT id, value1, value2, value3, value4, reading_time FROM Sensor order by reading_time desc limit 400";

$result = $conn->query($sql);

while ($data = $result->fetch_assoc()){
    $sensor_data[] = $data;
}

$readings_time = array_column($sensor_data, 'reading_time');

$value1 = json_encode(array_reverse(array_column($sensor_data, 'value1')), JSON_NUMERIC_CHECK);
$value2 = json_encode(array_reverse(array_column($sensor_data, 'value2')), JSON_NUMERIC_CHECK);
$value3 = json_encode(array_reverse(array_column($sensor_data, 'value3')), JSON_NUMERIC_CHECK);
$value4 = json_encode(array_reverse(array_column($sensor_data, 'value4')), JSON_NUMERIC_CHECK);

$reading_time = json_encode(array_reverse($readings_time), JSON_NUMERIC_CHECK);
$result->free();
$conn->close();
?>

<!DOCTYPE html>
<html>
<meta name="viewport" content="width=device-width, initial-scale=1">
  <script src="https://code.highcharts.com/highcharts.js"></script>
  <script src="https://code.highcharts.com/highcharts.js"></script>
  <script src="https://code.highcharts.com/modules/data.js"></script>
  <script src="https://code.highcharts.com/modules/exporting.js"></script>
  <script src="https://code.highcharts.com/modules/export-data.js"></script>
  <script src="https://code.highcharts.com/modules/accessibility.js"></script>
  <style>
    body {
      min-width: 310px;
    	max-width: 1280px;
    	height: 500px;
      margin: 0 auto;
    }
    h2 {
      font-family: Arial;
      font-size: 2.5rem;
      text-align: center;
    }
  </style>
  <body>
    <h2>Temp control</h2>
    <div id="chart-temperature" class="container"></div>
    <div id="chart-humidity" class="container"></div>
    <div id="chart-temperature2" class="container"></div>
    <div id="chart-humidity2" class="container"></div>


<script>

var value1 = <?php echo $value1; ?>;
var value2 = <?php echo $value2; ?>;
var value3 = <?php echo $value3; ?>;
var value4 = <?php echo $value4; ?>;
var reading_time = <?php echo $reading_time; ?>;


var chartT = new Highcharts.Chart({
  chart:{ renderTo : 'chart-temperature',
        zoomType: 'x',
        panning: true,
        panKey: 'shift' },
  title: { text: 'Temperatura camera Ale' },
  series: [{
    showInLegend: false,
    data: value1
  }],
  plotOptions: {
    line: { animation: false,
      dataLabels: { enabled: true }
    },
    series: { color: '#059e8a' }
  },
  xAxis: {
    type: 'datetime',
    categories: reading_time
  },
  yAxis: {
    title: { text: 'Temperature (Celsius)' }
    //title: { text: 'Temperature (Fahrenheit)' }
  },
  credits: { enabled: false }
});

var chartH = new Highcharts.Chart({
  chart:{ renderTo:'chart-humidity2',
           zoomType: 'x',
           panning: true,
           panKey: 'shift'},
  title: { text: 'Umidità camera Ale' },
  series: [{
    showInLegend: false,
    data: value4
  }],
  plotOptions: {
    line: { animation: false,
      dataLabels: { enabled: true }
    }
  },
  xAxis: {
    type: 'datetime',
    //dateTimeLabelFormats: { second: '%H:%M:%S' },
    categories: reading_time
  },
  yAxis: {
    title: { text: 'Humidity (%)' }
  },
  credits: { enabled: false }
});

var chartH = new Highcharts.Chart({
  chart:{ renderTo:'chart-humidity',
           zoomType: 'x',
           panning: true,
           panKey: 'shift'},
  title: { text: 'Umidità camera Ale' },
  series: [{
    showInLegend: false,
    data: value2
  }],
  plotOptions: {
    line: { animation: false,
      dataLabels: { enabled: true }
    }
  },
  xAxis: {
    type: 'datetime',
    //dateTimeLabelFormats: { second: '%H:%M:%S' },
    categories: reading_time
  },
  yAxis: {
    title: { text: 'Humidity (%)' }
  },
  credits: { enabled: false }
});


var chartT = new Highcharts.Chart({
  chart:{ renderTo : 'chart-temperature2',
        zoomType: 'x',
        panning: true,
        panKey: 'shift' },
  title: { text: 'Temperatura cucina' },
  series: [{
    showInLegend: false,
    data: value3
  }],
  plotOptions: {
    line: { animation: false,
      dataLabels: { enabled: true }
    },
    series: { color: '#059e8a' }
  },
  xAxis: {
    type: 'datetime',
    categories: reading_time
  },
  yAxis: {
    title: { text: 'Temperature (Celsius)' }
    //title: { text: 'Temperature (Fahrenheit)' }
  },
  credits: { enabled: false }
});
</script>
</body>
</html>To avoid discrepancies between data and time interval i suggest to create different table for each esp8266.
So create new table like previous section with different name.
CREATE TABLE Sensor2 (
    id INT(6) UNSIGNED AUTO_INCREMENT PRIMARY KEY,
    value5 VARCHAR(10),
    value6 VARCHAR(10),
    reading_time TIMESTAMP DEFAULT CURRENT_TIMESTAMP ON UPDATE CURRENT_TIMESTAMP
)
Copy post-data.php into new file like post-data1.php and change table name.
$sql = "INSERT INTO Sensor2 (value5, value6)
        VALUES ('" . $value5 . "', '" . $value6 . "')";
Change also serverName in the ESP8266 sketch.
const char* serverName = "http://yourdomain.it/post-data1.php";Now is possible to control that the table Sensor2 is effectively update with new data.
If everything is alright open esp-chart.php and duplicate the connection to the sql server and change the second table name in Sensor2.
So the code look like this:
<?php

$servername = "localhost";

// REPLACE with your Database name
$dbname = "DBNAME";
// REPLACE with Database user
$username = "USERNAME";
// REPLACE with Database user password
$password = "PASSWORD";

// Create connection
$conn = new mysqli($servername, $username, $password, $dbname);
// Check connection
if ($conn->connect_error) {
    die("Connection failed: " . $conn->connect_error);
}

$sql = "SELECT id, value1, value2, value3, value4, reading_time FROM Sensor order by reading_time desc limit 40";

$result = $conn->query($sql);

while ($data = $result->fetch_assoc()){
    $sensor_data[] = $data;
}

$readings_time = array_column($sensor_data, 'reading_time');

$value1 = json_encode(array_reverse(array_column($sensor_data, 'value1')), JSON_NUMERIC_CHECK);
$value2 = json_encode(array_reverse(array_column($sensor_data, 'value2')), JSON_NUMERIC_CHECK);
$value3 = json_encode(array_reverse(array_column($sensor_data, 'value3')), JSON_NUMERIC_CHECK);
$value4 = json_encode(array_reverse(array_column($sensor_data, 'value4')), JSON_NUMERIC_CHECK);

$reading_time = json_encode(array_reverse($readings_time), JSON_NUMERIC_CHECK);

$result->free();
$conn->close();

// second table Sensor2

// Create connection
$conn = new mysqli($servername, $username, $password, $dbname);
// Check connection
if ($conn->connect_error) {
    die("Connection failed: " . $conn->connect_error);
}

$sql = "SELECT id, value5, value6, reading_time FROM Sensor2 order by reading_time desc limit 40";

$result = $conn->query($sql);

while ($data = $result->fetch_assoc()){
    $sensor_data[] = $data;
}

$readings_time2 = array_column($sensor_data, 'reading_time');

$value6 = json_encode(array_reverse(array_column($sensor_data, 'value6')), JSON_NUMERIC_CHECK);
$value5 = json_encode(array_reverse(array_column($sensor_data, 'value5')), JSON_NUMERIC_CHECK);

$reading_time2 = json_encode(array_reverse($readings_time), JSON_NUMERIC_CHECK);

$result->free();
$conn->close();

?>It is interesting to be able to observe the graph for different time intervals.
To do it copy esp-chart.php into new file and change the following lines:
$sql = "SELECT id, value1, value2, value3, reading_time FROM Sensor3 order by reading_time desc limit 24";In this case the number 24 represents 2 hours of data reading. As it is set up (t3=300000) the sensor uploads a reading to the server every 5 minutes. It is possible to set different times intervals.
Set:
72for 6 hours and save it asesp-chart-1d.php288for 24 hoursesp-chart-1d.php
Now add buttons:
Add some css style into esp-chart.php:
 .containerbt {
    height: 100px;
    position: relative;
    }

    .center {
      margin: 0;
      position: absolute;
      top: 50%;
      left: 50%;
      -ms-transform: translate(-50%, -50%);
      transform: translate(-50%, -50%);
    }
    .button {
      position: relative;
      background-color: #4CAF50;
      border: none;
      font-size: 20px;
      color: #FFFFFF;
      padding: 20px;
      width: 150px;
      text-align: center;
      -webkit-transition-duration: 0.4s; /* Safari */
      transition-duration: 0.4s;
      text-decoration: none;
      overflow: hidden;
      cursor: pointer;
      border-radius: 10px;
    }

    .button:after {
      content: "";
      background: #90EE90;
      display: block;
      position: absolute;
      padding-top: 300%;
      padding-left: 350%;
      margin-left: -20px!important;
      margin-top: -120%;
      opacity: 0;
      transition: all 0.8s
    }

    .button:active:after {
      padding: 0;
      margin: 0;
      opacity: 1;
      transition: 0s
    }
  .button:hover {background-color: #3e8e41}
And add link in the <body>section:
<h2>Temp control</h2>
    <div class="containerbt">
      <div class="center">
        <a class="button" href="http://tempcontrol.it/esp-chart-6h.php">6 Ore</a>
        <a class="button" href="http://tempcontrol.it/esp-chart-1d.php">24 Ore</a>
      </div>
    </div>
    <div id="chart-temperature" class="container"></div>
    <div id="chart-humidity" class="container"></div>
    <div id="chart-temperature2" class="container"></div>
    <div id="chart-humidity2" class="container"></div>
    <div id="chart-temperature4" class="container"></div>
    <div id="chart-temperature3" class="container"></div>
Look like this and it is fully personalizable.

The graph is based on Highchart software interactive JavasSript chart.
This chart is fully personalizable.
To edit chart properties you have to change Javascript code section.
This section is the snippet like:
var chartH = new Highcharts.Chart({
  chart:{ renderTo:'chart-humidity'
          },
  title: { text: 'Umidità camera Ale' },
  series: [{
    showInLegend: false,
    data: value2
  }],
  plotOptions: {
    line: { animation: false,
      dataLabels: { enabled: true }
    }
  },
  xAxis: {
    type: 'datetime',
    //dateTimeLabelFormats: { second: '%H:%M:%S' },
    categories: reading_time
  },
  yAxis: {
    title: { text: 'Humidity (%)' }
  },
  credits: { enabled: false }
});Ad in the php file esp-chart.php the following snippet in the chart:{ } section:
chart:{ renderTo : 'chart-temperature',
        zoomType: 'x',
        panning: true,
        panKey: 'shift' },
This allow to select area and zoom in. It is also possible to pan chart by continue pressing shift and scrolling with mouse.


It work also on mobile device.
If there is a lot of data it may be useful to remove the labels
Set false in:
plotOptions: {
    line: { animation: false,
      dataLabels: { enabled: false }
}There are several ways to secure this page. Most are safer but more complex than the one presented. A simple method is to add the following code and add the part of the code related to the charts inside it.
<?php
// -------------------------
$password = '123456789';
// -------------------------

$pwd = isset($_GET['pwd']) ? $_GET['pwd'] : false;
if (!$pwd || $pwd != $password) {
  ?>
<form method="get" action="<?php echo $_SERVER['PHPSELF']; ?>">
<table border="0" cellspacing="0" cellpadding="10">
<?php if ($pwd !== false): ?><tr class="errore"><td colspan="3">La password inserita non è corretta!</td></tr><?php endif; ?>
<tr>
  <td>Password</td>
  <td><input type="password" name="pwd" style="width: 180px;"/></td>
  <td><input type="submit" value="Entra"/></td>
</tr>
</table>
</form>
  <?php
}else{
  ?>
...
... div_section_for_charts...
...
  <?php
}
?>
Insert your password in YOURPASSWORD.
Put this snippet in place of the <div> of the charts and insert the graphs <div> in place of the div_section_for_charts... .
It is worth mentioning the possibility of using the tasmota firmware to transform the esp 8266 into an intelligent actuator. With this opnesource firmware we can easily control and update the devices locally. We can also use timers and rules to automate everything.
In this case we use it to add 6 home automation outputs to control 6 relays at 220 V. we use a multiple relay board with 5V power supply and 3.3V-5V logic converter.
These smart outputs integrate easily with alexa to other alexa home automation systems.
The best way to setup tasmota firmware is to download tasmotizer. Install from PyPI using pip:
- Upgrade pip and wheel packages:
pip3 install --upgrade pip wheel - Install tasmotizer:
pip3 install tasmotizer - Then simply run
tasmotizer.pyfrom the shell/command line
Now download latest firmare .bin and load it by press Tasmotize!

Now connect directly to the devices access point and configure wireless settings.
After successful Internet connections, access the local IP of the devices from the browser.
Set the Template with pin for user use and set the Module by connecting pin with numeric index. This numeric index rapresent the smart output.


It is necessary to set the output as relay if you want to use the output as a switch or you can set it as a button or with many other options.
Now it is possibile to controll the output from web server and connect it with Alexa by emulating Philips Hue Sistem (ad new devices, select Philips Hue Bridge V1). it is also possibile to set timer or clever rules.
The web server:

It is also important to set the right time zone so open the console from web server and:
NtpServer, to verify that the device can read timeTimeSTD 0, 0, 10, 1, 3, 60andTimeDST 0, 0, 3, 1, 2, 120to set winter (STD) and summer (DST) timeTimezone 99, to disable the deviation from UTC leaving valid the commands for STD and DST time
It is also important to set the correct longitude and latitude to properly work with sunrise and sunset rules for the timers:
longitude 12.492373latitude 41.890251For other info tasmota.com.
An example for schematic:

It is useful to use relay module:

This board is very convenient as in addition to the relay it contains a status led, the switching transistor and the freewheeling diode. Power LED is also a SMD type and it shows the status of power source connected with the 5V single channel relay module. A freewheeling diode is connected across the coil to avoid the effect of back EMF. It is also known as a flyback diode. The coil used in the relay is an inductive type. When the current passes through an inductive load, it produces an back EMF voltage. This back EMF may damage the circuit. Therefore, a freewheeling diode is used to avoid this effect.
The maximum current sourcing capability of GPIO pins is generally less than 20mA. Hence, a switching transistor is used in this relay module to amplify current to the level of the minimum current requirement of the relay coil. By using a switching transistor, we can control the relay from the GPIO pin of a microcontroller.

It is also possibile to use all in one board with ESP 8266 and relay to reduce size. Like this:

It is also very interesting to watch how these devices connect to the local network through a sunburst graph. these devices integrate easily with all home automation available on the market and allow their control from a single platform, in this case via the Alexa system.
The map was obtained via the PRTG network monitor.

For example:

Real application - Prototype no. 2 - Tasmota and board equipped with DHT11 (Sinric + Home Automation) - In this example only 3 of the 6 relays provided are used. The circuit includes a 5V power supply, level converter, relays and equipped NodeMCU.
It is obvious the possibility of optimizing everything by transferring it to a PCB circuit, eliminating all that is useless and using only the devices necessary for operation. This certainly implies an increase in production costs but would allow to reduce the dimensions by a lot. It is clear that a larger scale production must first be evaluated and certainly not for the test phase.
An interesting real application of what has been studied in this project is the TCS - Solar Heating Control Unit developed for a company active in the field of air conditioning and specialized in heating systems.
The DHT11 will be replaced by a DHT22, much more precise.
| DHT11 | DHT22 | |
|---|---|---|
| Humidity range | 20-90% RH | 0-100% RH |
| Humidity accuracy | ±5% RH | ±2% RH |
| Temperature range | 0-50 °C | -40-80 °C |
| Temperature accuracy | ±2% °C | ±0.5% °C |
| Reading time | 6-10 sec | 2 sec |
- @mastroalex
- Graphic Design - @Alina Elena Mihai
- Hosting and server setting @letoinformatics
- Supplies of material and technical help @termoclimaservice
- ESP32/ESP8266 Publish Data to Raspberry Pi LAMP Server
- ESP8266 DS18B20
- ALEXA ECHO comunica con ESP32 and ESP8266 utilizzando SINRIC
- SinricPro (ESP8266 / ESP32 SDK)
- ESP32 DHT11/DHT22 Web Server
- Alexa comunica con ESP32 and ESP8266 utilizzando SINRIC con sonoff
- DIY Cloud Weather Station with ESP32/ESP8266
- Control ESP32 and ESP8266 GPIOs from Anywhere in the World
- ESP8266 DHT11/DHT22 Temperature and Humidity Web Server with Arduino IDE
- Sinric.com
- SinricPro (ESP8266 / ESP32 SDK)
- Sinric Example for ESP
- DIY Air Quality Monitor
- Visualize Your Sensor Readings from Anywhere in the World
- Thermal comfort
- A Meta-Analysis of Performance Response Under Thermal Stressors
- Thermoregulatory responses to environmental toxicants
- The Importance of Humidity in the Relationship between Heat and Population Mental Health
- Why is lighting in the workplace important?
- Lighting Ergonomics - General
- Eye Discomfort in the Office
- Lighting Ergonomics - Survey and Solutions
- 3 basics type of lighting