The Homogeneity & Location Index : A Statistical Framework for the Classifcation of ordinal categorical data
The objective of this work is to provide tools to be used for the classification of ordinal categorical distributions. To demonstrate how to do it, we propose an Homogeneity (HI) and Location (LI) Index to measure the concentration and central value of an ordinal categorical distribution. We also provide a transparent set of criteria that a user can follow to establish if a given HI's value indicates a "high" or "low" concentration of values around the central value of a distribution. Finally, we provide a Concentration Index (CI) for the classifcation of nominal categorical variables.
We applied our framework to assess the socioeconomic homogenity of the commonly used [SA3](https://www.abs.gov.au/websitedbs/D3310114.nsf/home/Australian+Statistical+Geography+Standard+(ASGS) Australian Census geography. In particular, we look at the population distribution in the SA3's IRSD (Index of Relative Socioeconomic Disadvantage) decile category.
For more information about this work, the interested reader can refer to the publication: A framework for the identification and classification of homogeneous socioeconomic areas in the analysis of health care variation.
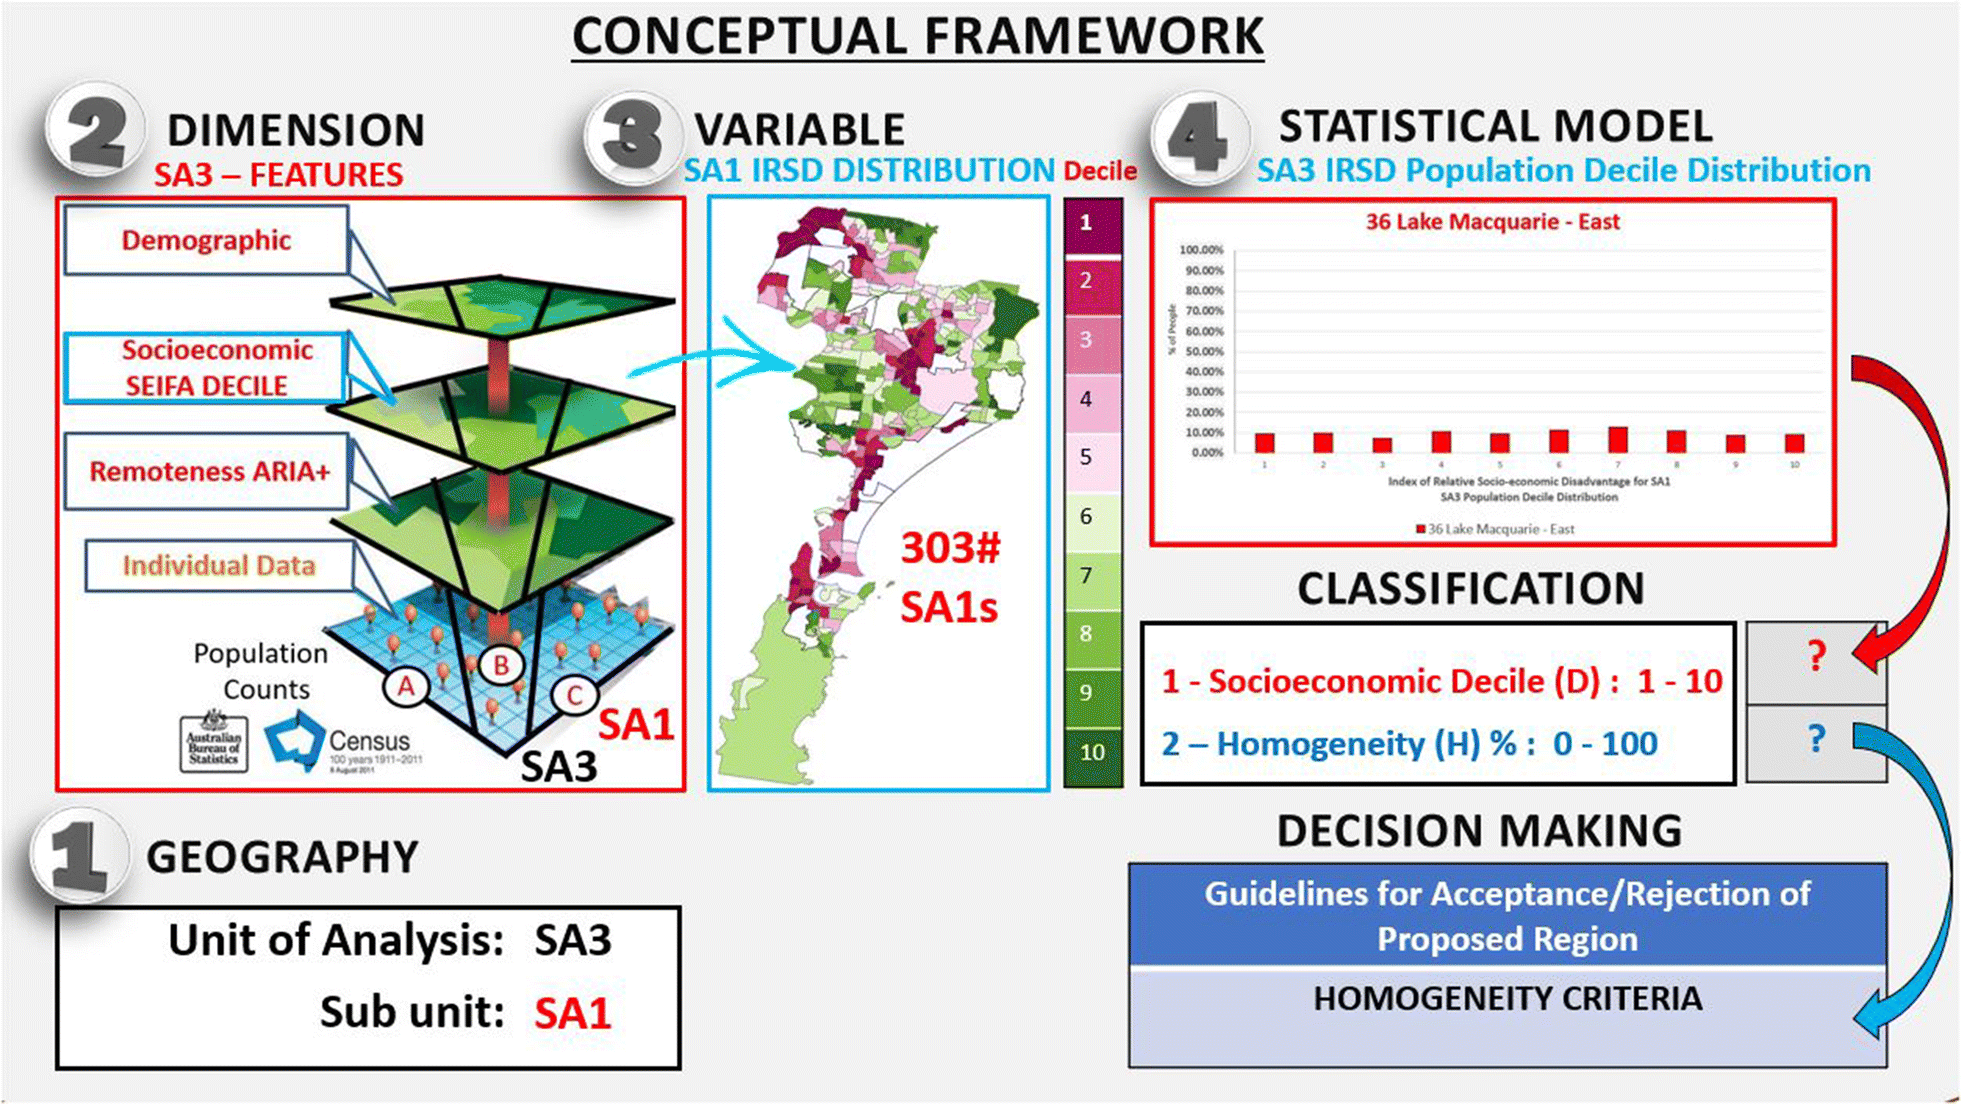
Figure 1. Conceptual Framework for the classifcation of homogenous areas. Source: International Journal of Health Geographics
- Description
- R Files
- Dependencies
- Usage
- Guidelines for contributing
- Author
- License
- Funding
- Future Work
- Notes
- Contacts
Conceptually, the HI's value of a distribution (pdf) is a number between 0 (uniform pdf) and 1 (singleton pdf), that is defined as the degree to which the population is concentrated among the set of categories for that area. For example, in the case of the IRSD decile, an HI of zero expresses minimal concentration and occurs when the population is equally distributed among all decile categories (i.e an IRSD decile contains 10% of the population). Conversely, an HI value equals to 1 is attained if the whole population is concentrated in a single decile. In the latter case, there is no variation within the area in that characteristic and the geography is uniquely identified by the central value of the distribution.
The LI of a distribution refers to the category which could be considered representative of the entire population in a unit. For example, in the case of the IRSD decile distribution is an integer ranging from 1 (most disadvantaged) to 10 (least disadvantaged).
The formal defintitions and statistical properties of the HI and LI are illustrated in the Additional File of the publication: Model
The dataSa3.csv file contains 330 SA3s and 15 columns:
- id: SA3 sequential Identifier
- SA3_code: ABS - 2016 SA3's code identifier
- SA3_name: SA3's state name
- State_code: ABS - 2016 SA3's State code identifier
- State_name: SA3's State name
- Columns (6-15): d1,d2,d3,...,di,...,d10. Number of people in each decile.
ABS: Australian Bureau of Statistics.
The hi_li.R file contains the implementation of the Homogeneity Index (HI) function [uni.hom] and the Location Index function [uni.loc].
It also includes the following statistical utilities:
- [uni.conCI]: computes the convolution of two vectors
- [uni.corr]: computes the autocorrelation of a vector
- [uni.div]: computes the Divergence Index. It's a variance for ordinal categorical variables.Please refer to Model.
The create_SA3.R contains the script to generate a new table with the first 15 columns of dataSA3.csv and 4 additional columns:
- Hom: The value of the Homogeneity Index - HI ϵ [0 1]
- DI: The value of the Divergence Index - DI ϵ [0 1]
- LI: The value of the Location Index - LI ϵ {1,2,..,10}
- CL: The Homogeneity Classification - CL ϵ {A,B,C,D}
Table 1. SA3's IRSD HI CLASSIFICATION CRITERIA
| CL | HI % | DECISION SUPPORT SYSTEM |
|---|---|---|
| A | [68.53 - 100] | Acceptably Homogeneous |
| B | [57.62 - 68.53) | Marginal Heterogeneity |
| C | [46.62 - 57.62) | Judgement Required |
| D | [0 - 46.62) | Heterogeneous |
Table 2. HI(s): HI's value of s equally populated deciles clustered on s consecutive bins
| s | HI(s) % | pdf vector |
|---|---|---|
| 1 | 100 | [1 , 0 , 0 , 0 , 0 , 0 , 0 , 0 , 0 , 0] |
| 4 | 68.53 | [1/4 , 1/4 , 1/4 , 1/4 , 0 , 0 , 0 , 0 , 0 , 0] |
| 5 | 57.62 | [1/5 , 1/5 , 1/5 , 1/5 , 1/5 , 0 , 0 , 0 , 0 , 0] |
| 6 | 46.62 | [1/6 , 1/6 , 1/6 , 1/6 , 1/6 , 1/6 , 0 , 0 , 0 , 0] |
| 10 | 0 | [1/10 , 1/10 , 1/10 , 1/10 , 1/10 , 1/10 , 1/10 , 1/10 , 1/10 , 1/10] |
Table 1 shows the partition of the HI's range into four classes. The selection of the breaks among classes is determined by the HI's value of s equally populated deciles clustered on s consecutive bins. In this case, the parameter s sets the smallest interval of categories which contains all the data. Consider for example the value 68.53 (i.e s = 4, HI(4) = 68.53; Table 2), then all distributions that have a bigger HI's value (Cl = A) are equivalent to a community whose socioeconomic groups are concentrated in at most four consecutive deciles.
The parameter s is also known in the ecological literature as true diversity. Clearly, other criteria can be chosen for the identification of homogeneous distributions and there is no definitive or "optimal" HI's threshold value. However, we believe that the specification of s can help users to represent the homogenity of a distribution in "picture", and serves as a guide for interpreting dimensionless concentration indicies. For more information about the classifcation criteria and the notion of true diversity, the interested reader can refer to the publication: A framework for the identification and classification of homogeneous socioeconomic areas in the analysis of health care variation, sections Concentration Index and true diversity and Homogeneity Index and true diversity.
To run the scripts the following software requirements apply:
- R version 3.3.2 or later version
- library: data.table to read the dataset
Run the hi_li.R script to save the functions in the Global Environment Scope of the working directory. Then, place the create_SA3.R and the dataSa3.csv file in the working directory and run in the R console the create_SA3.R script. The output SA3db.csv is a 330 x 20 table.
Feel free to use the hi_li.R library to classify your categorical dataset. Enjoy 😊 !
I welcome contributions to the hi_li.R library. Please see the CONTRIBUTING file for detailed guidelines of how to contribute.
Ludovico Pinzari
The homogeneity-location-index package is licensed under the MIT. See the LICENSE file for more details.
This work was funded through a partnership agreement between the Capital Markets Cooperative Research Centre and the Australian Institute of Health and Welfare, which provided a Ph.D scholarship to me.
A complete discussion of the mathematical model is included in my thesis dissertation about to be submitted in June 2019. I'll soon share a link to my work. I'll also push new documentation and files to this repo.
If you wish to reproduce the results illustrated in the publication A framework for the identification and classification of homogeneous socioeconomic areas in the analysis of health care variation, please use the following dataset: data
For any enquiries about my work, please visit my web site: contacts or contact me on my linkedin profile: ludovico-pinzari