This project is a data visualization website that visualizes Greek Life at Duke University and shows the different trends in diversity in Greek Life at the School.
-Data
-Setup
-Libraries
-Project
-Acknowledgements
The data I propose to visualize for my project is the Duke University Greek Life Data Set. The dataset was originally published at Greek-Life-Demographics, this dataset contains the data The Chronicle used to analyze trends between those who do and don't join Greek life at Duke.
To run the website download the code from github using git clone and clone the repository into your local computer. After cloning the repository cd into project workspace, and run npm install to download the necessary node packages required to run the website. Once the node packages are done installing, use the command npm start on your terminal to run the project on your localhost:3000
I am using the following libraries and frameworks for the project :-
- React
- React DOM
- React Router DOM
- React CSV-TO-TABLE
- D3
- D3 Geo
- Material UI
- TopoJSON
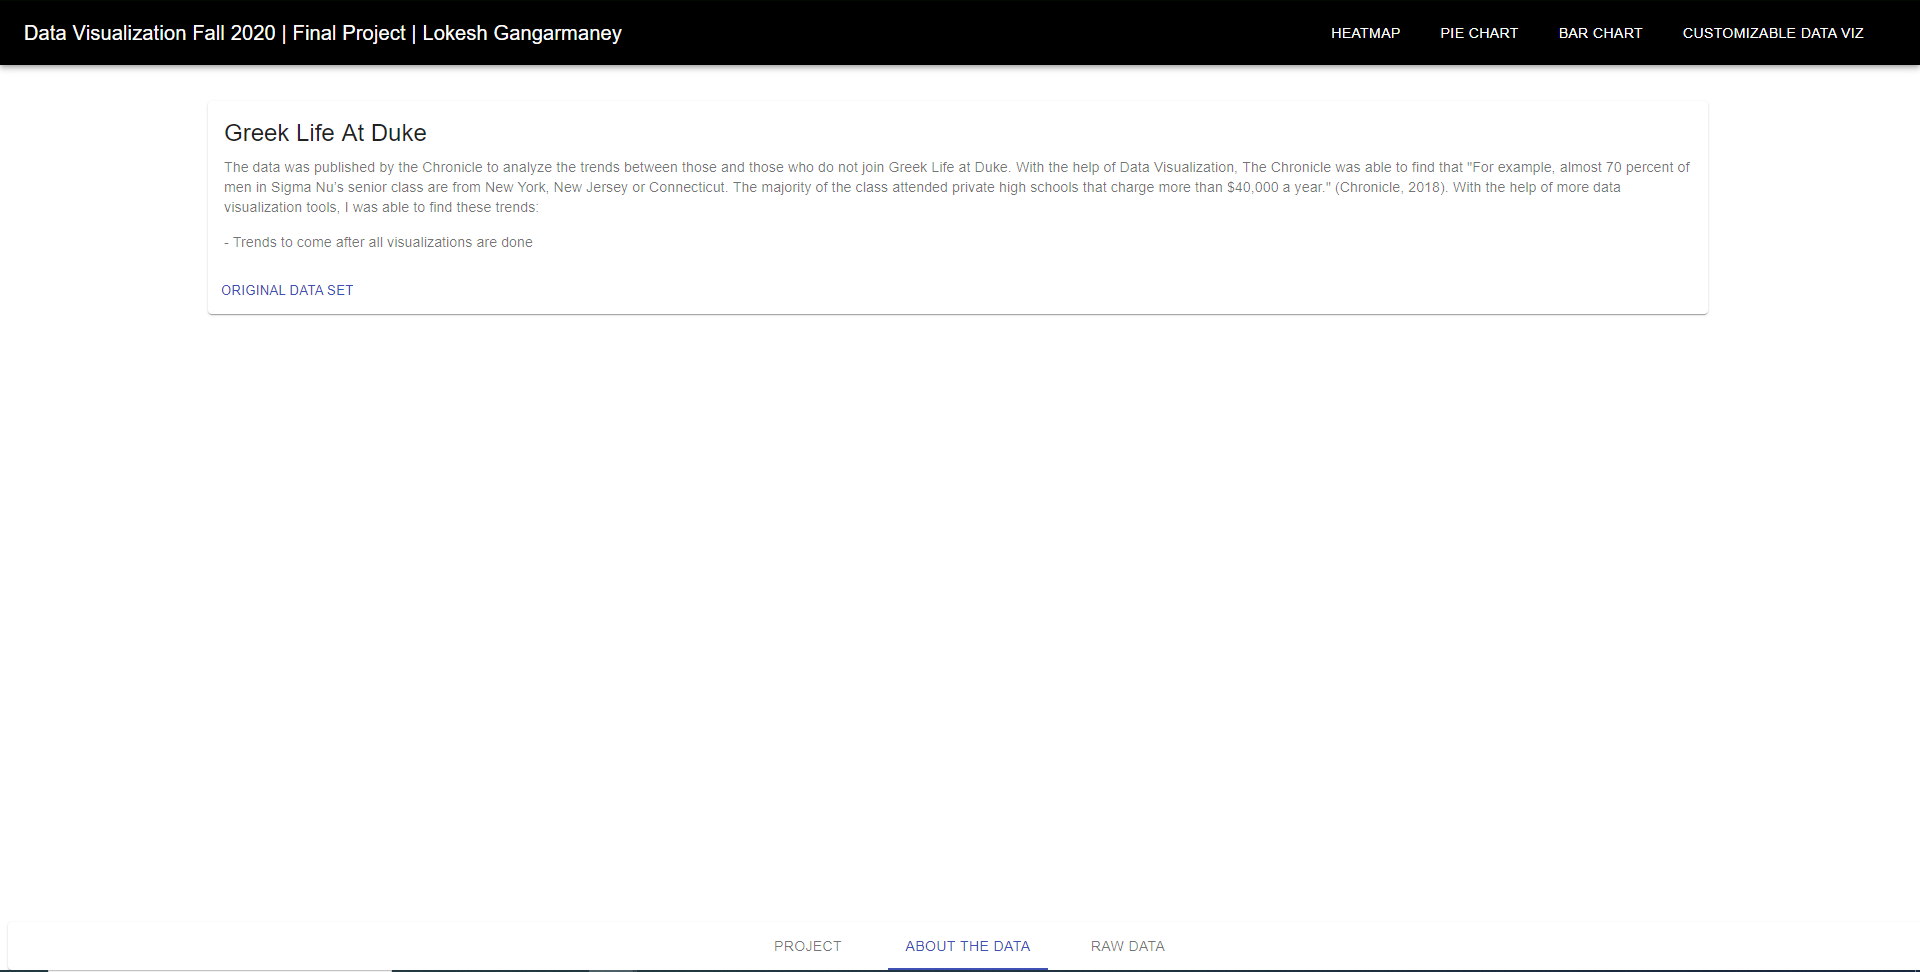
When you first open the project the website takes you to the home page where you can interact with the three bottom navigation tabs to get more information about the project. The three bottom navigation tabs are : Project, About the Data and Raw Data. The project page contains information about the project and is a copy this READMe file. When you click on About the data tab it gives you information about the data and links to the original dataset.
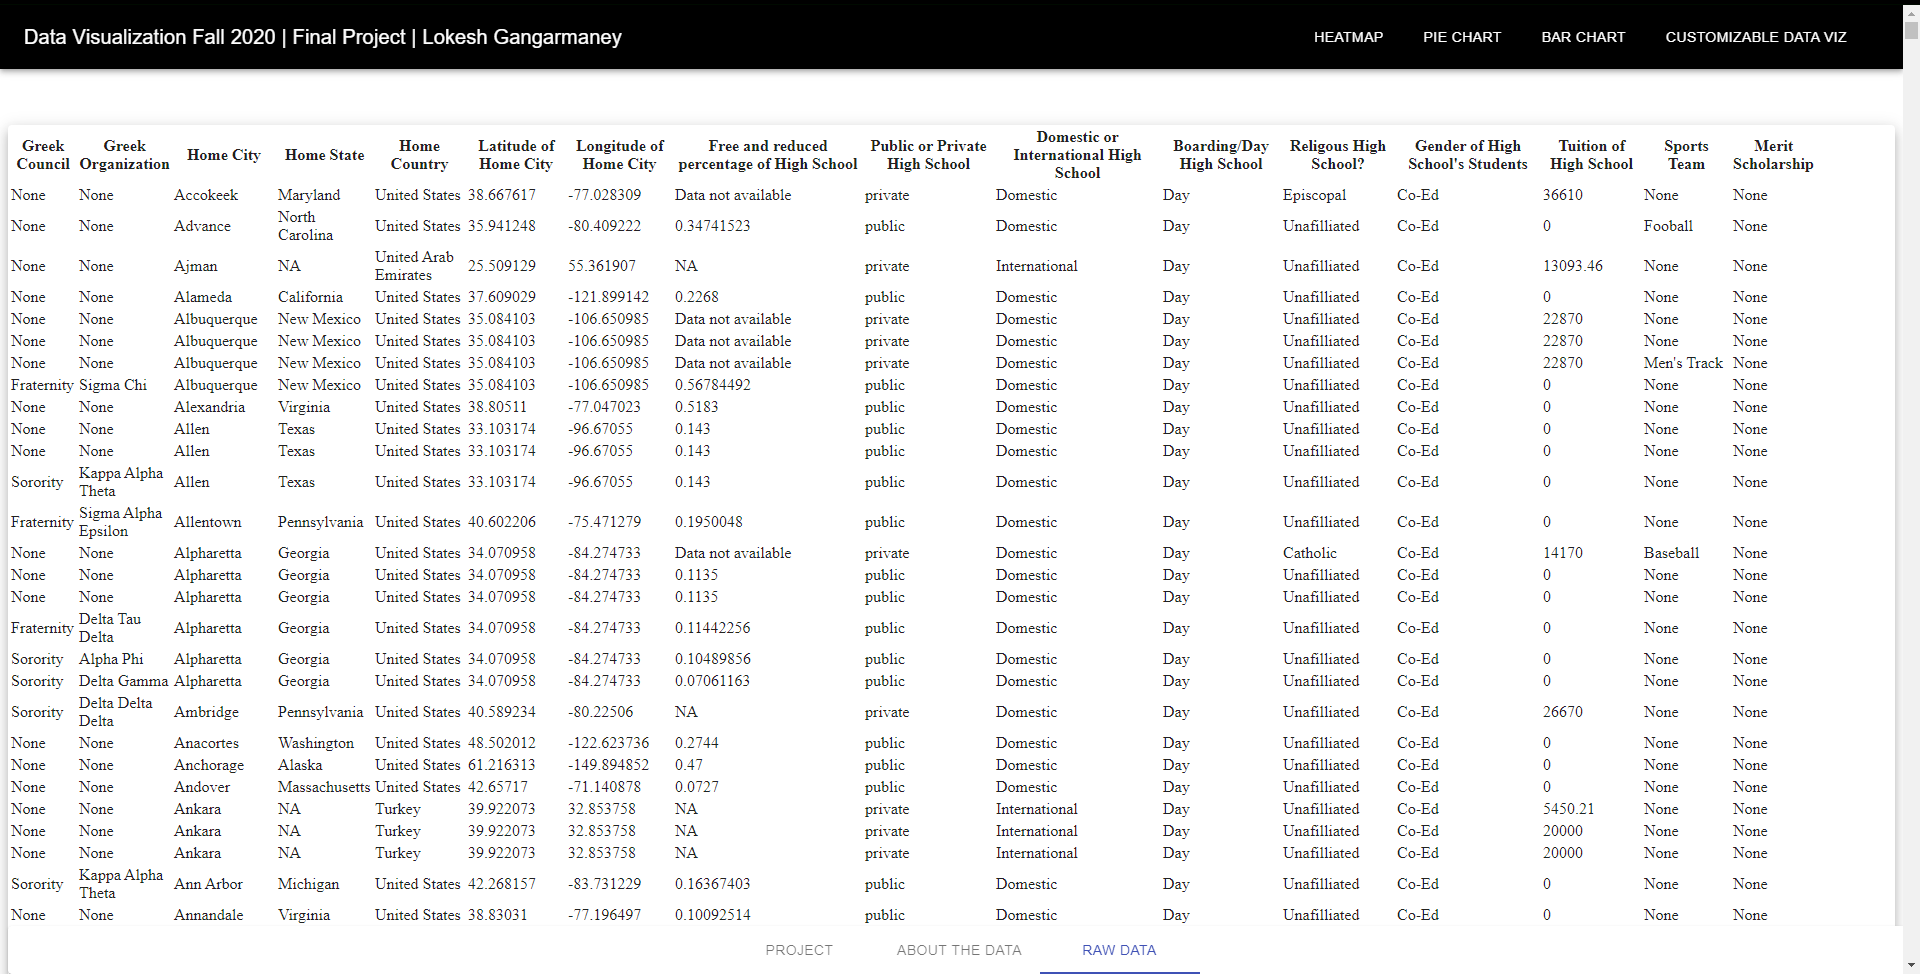
The raw data tab contains the data in a tabulated format with the help of csv-to-table library.
After getting some information about the data you can choose which data visualization you want to visualize, you can choose any visualization from the top bar.
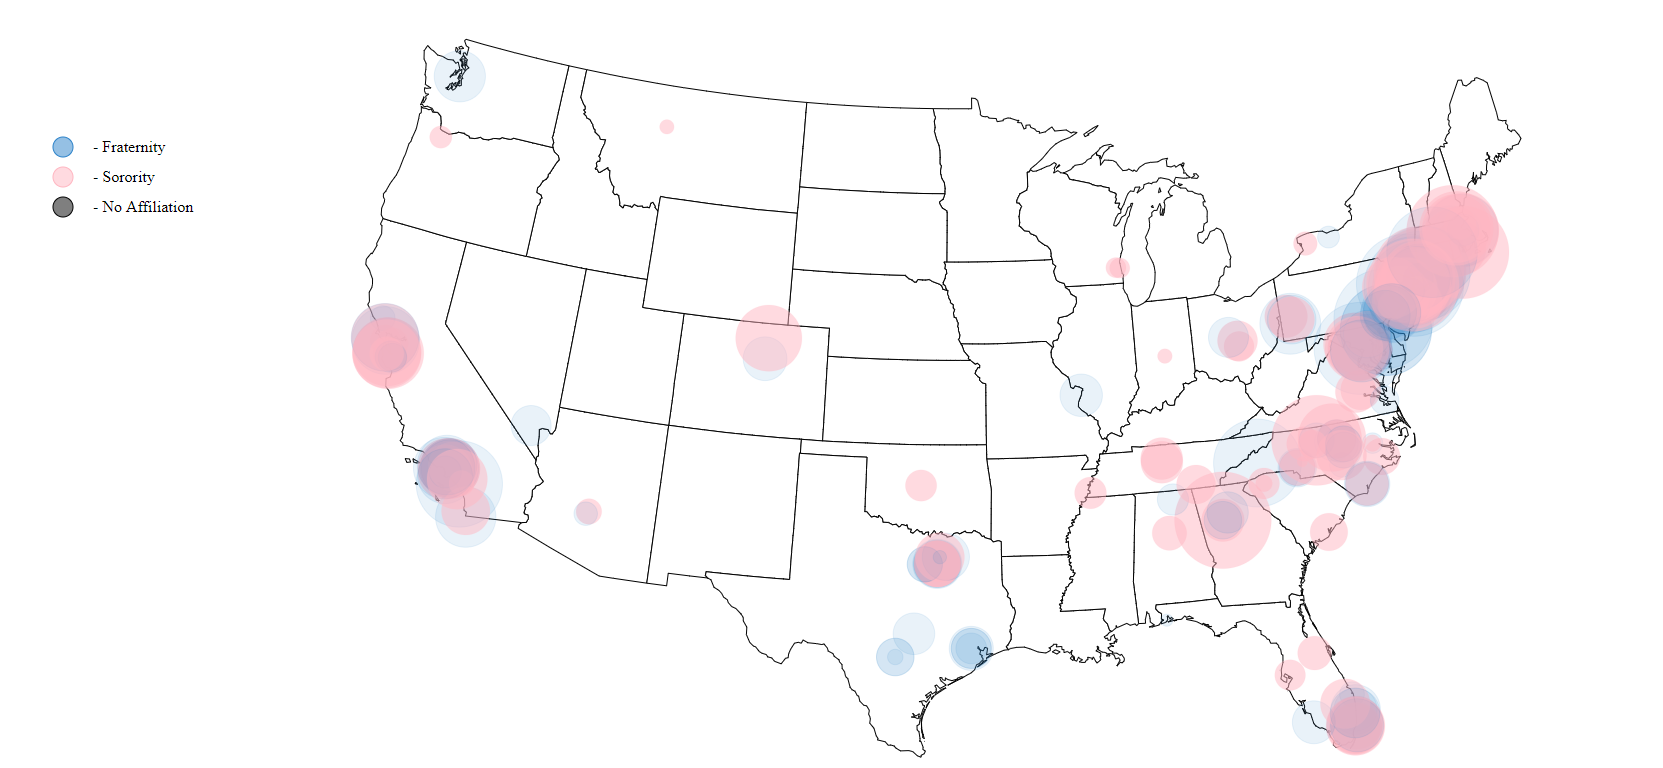
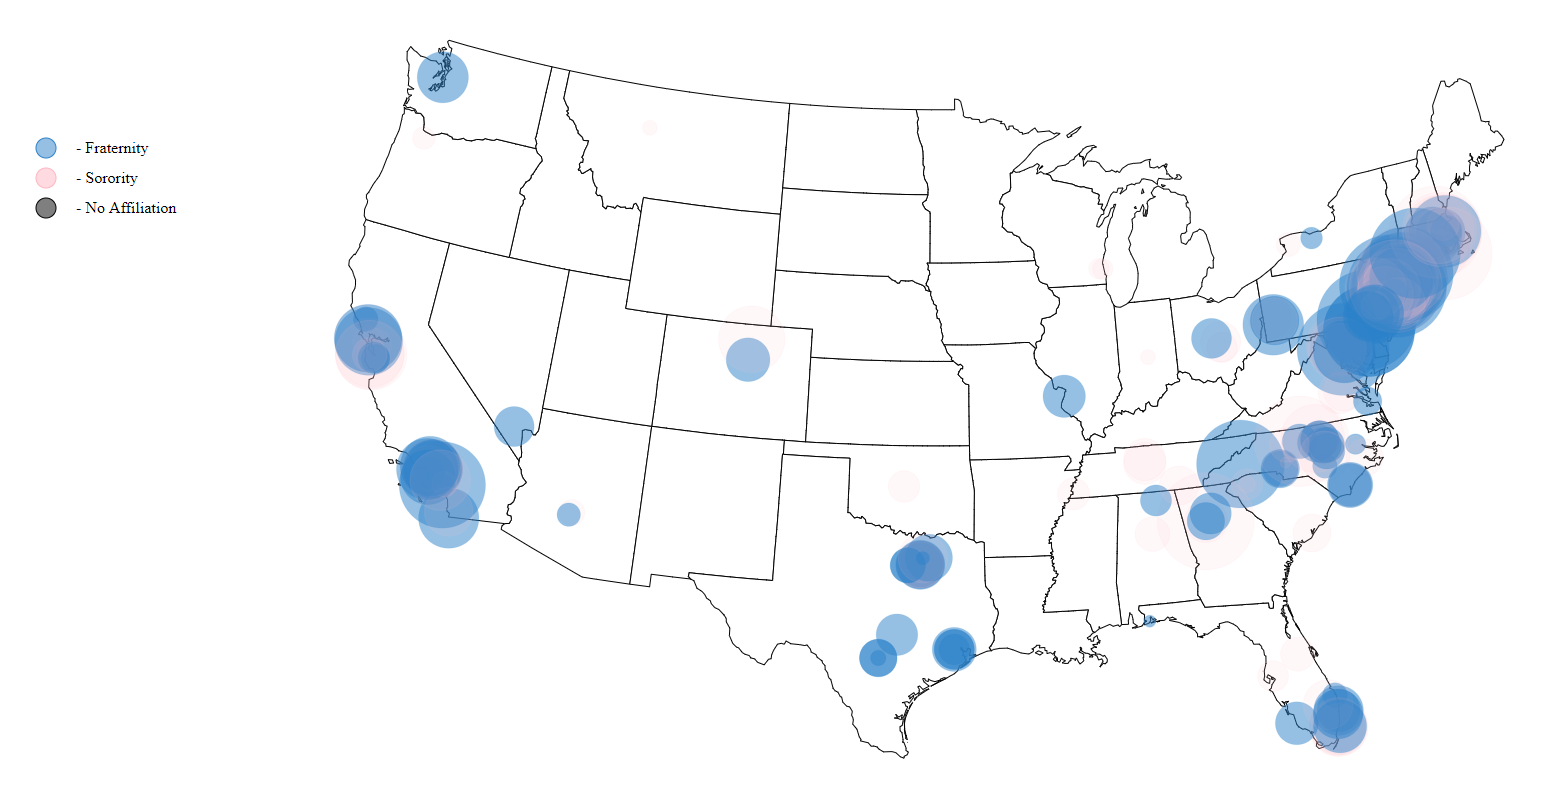
The Heatmap visualization provides a heatmap of the United States with a interactive color legend to explore where different students come from at Duke. The size of the circle represent the highschool price of different students.
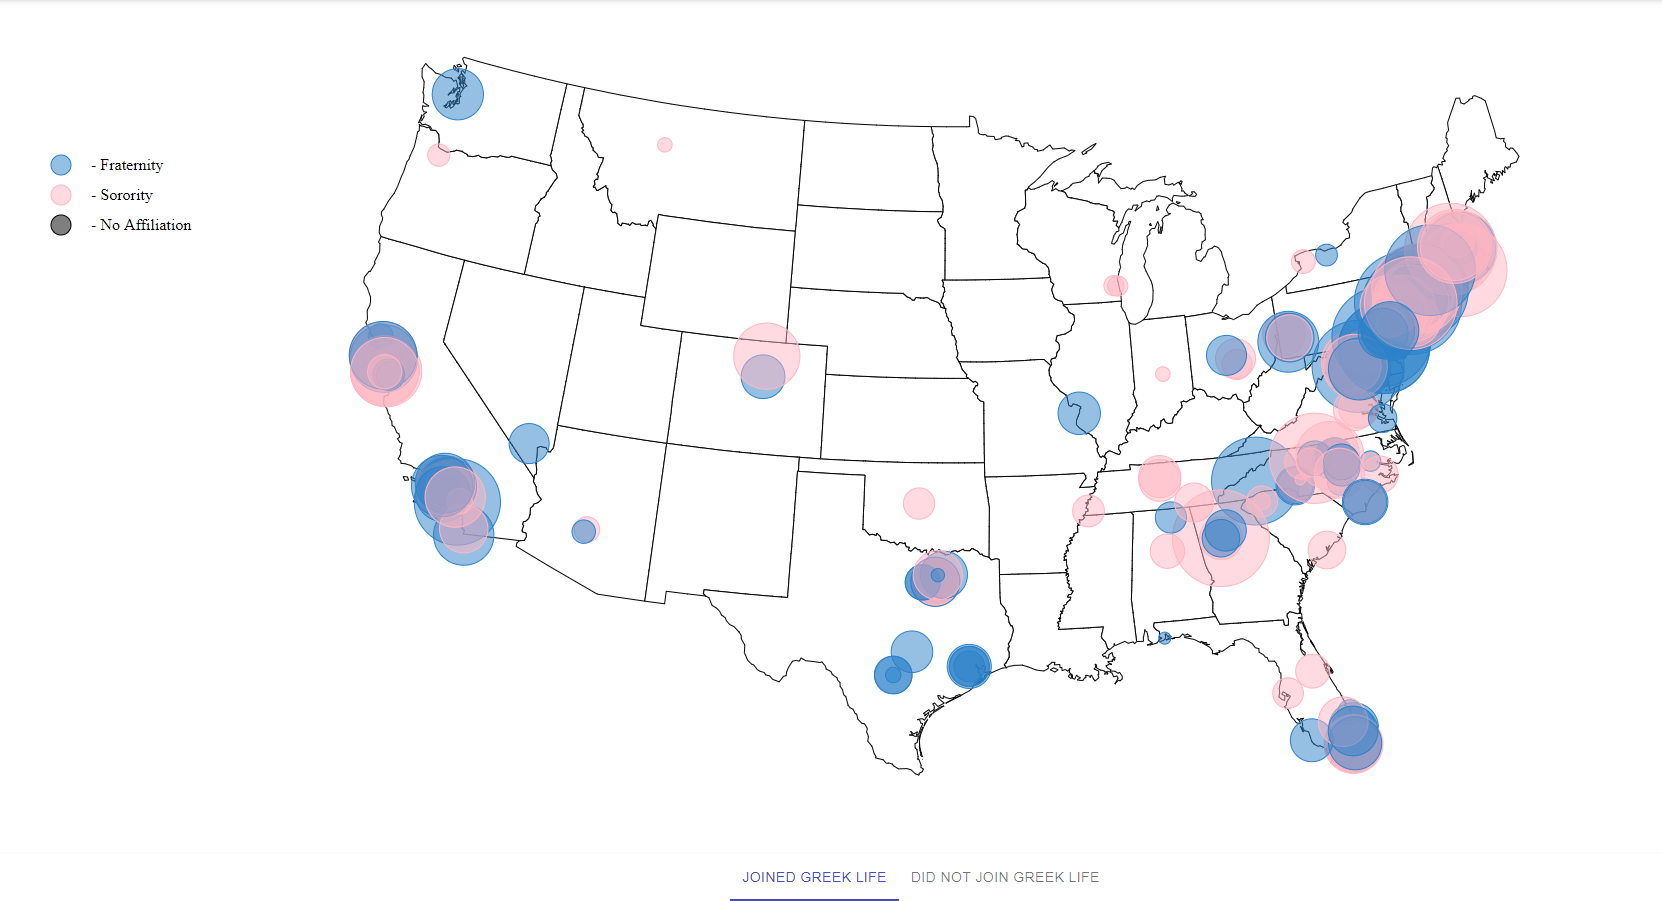
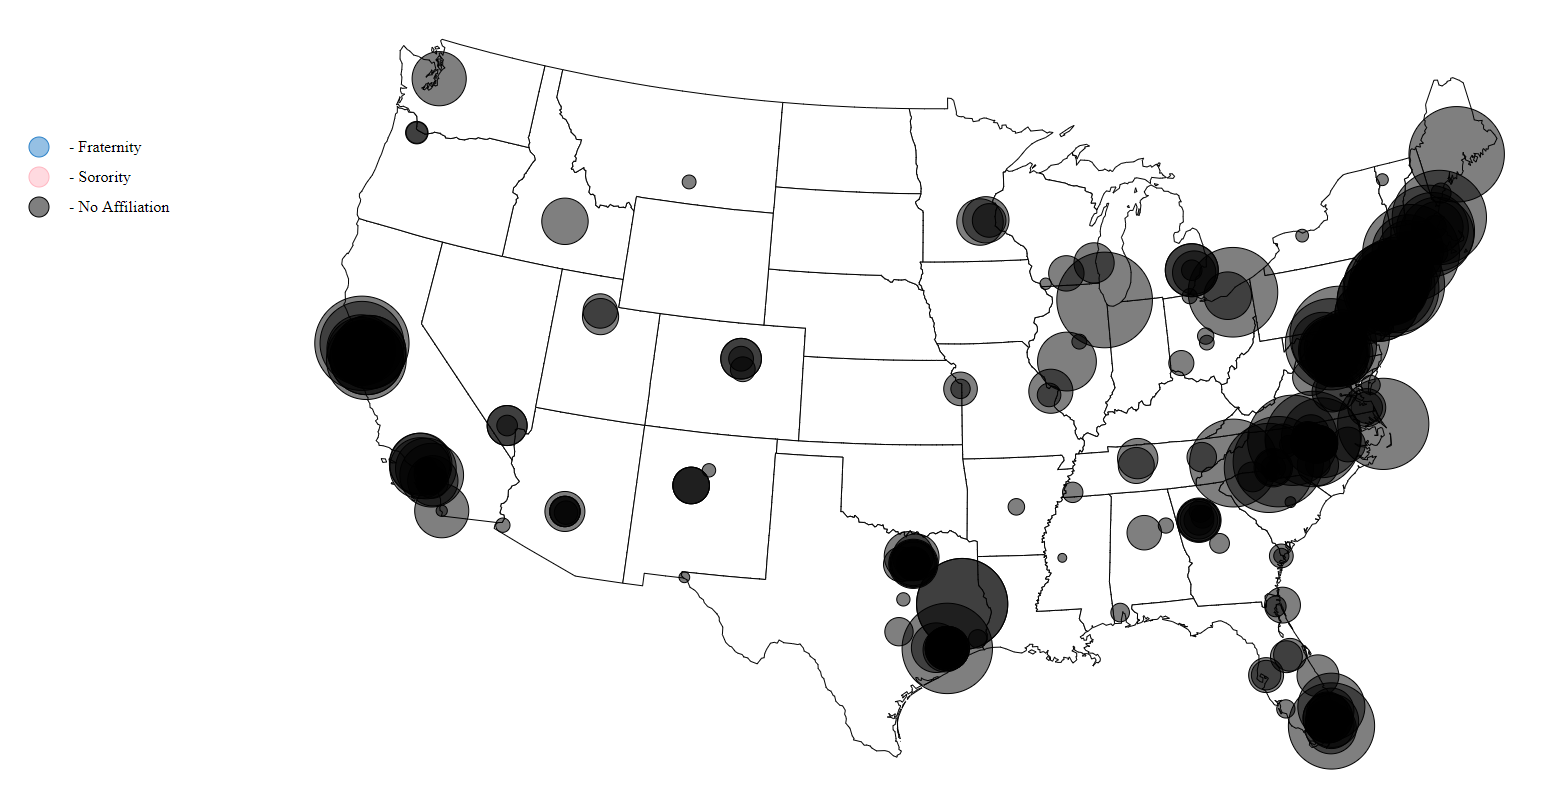
You can see the highschool price of different studenst that did not join any Greek Organization by clicking on the bottom navigationn.
The Heatmap has an interactive legend and when you hover over a specific legend the map will highlight the respective selection.
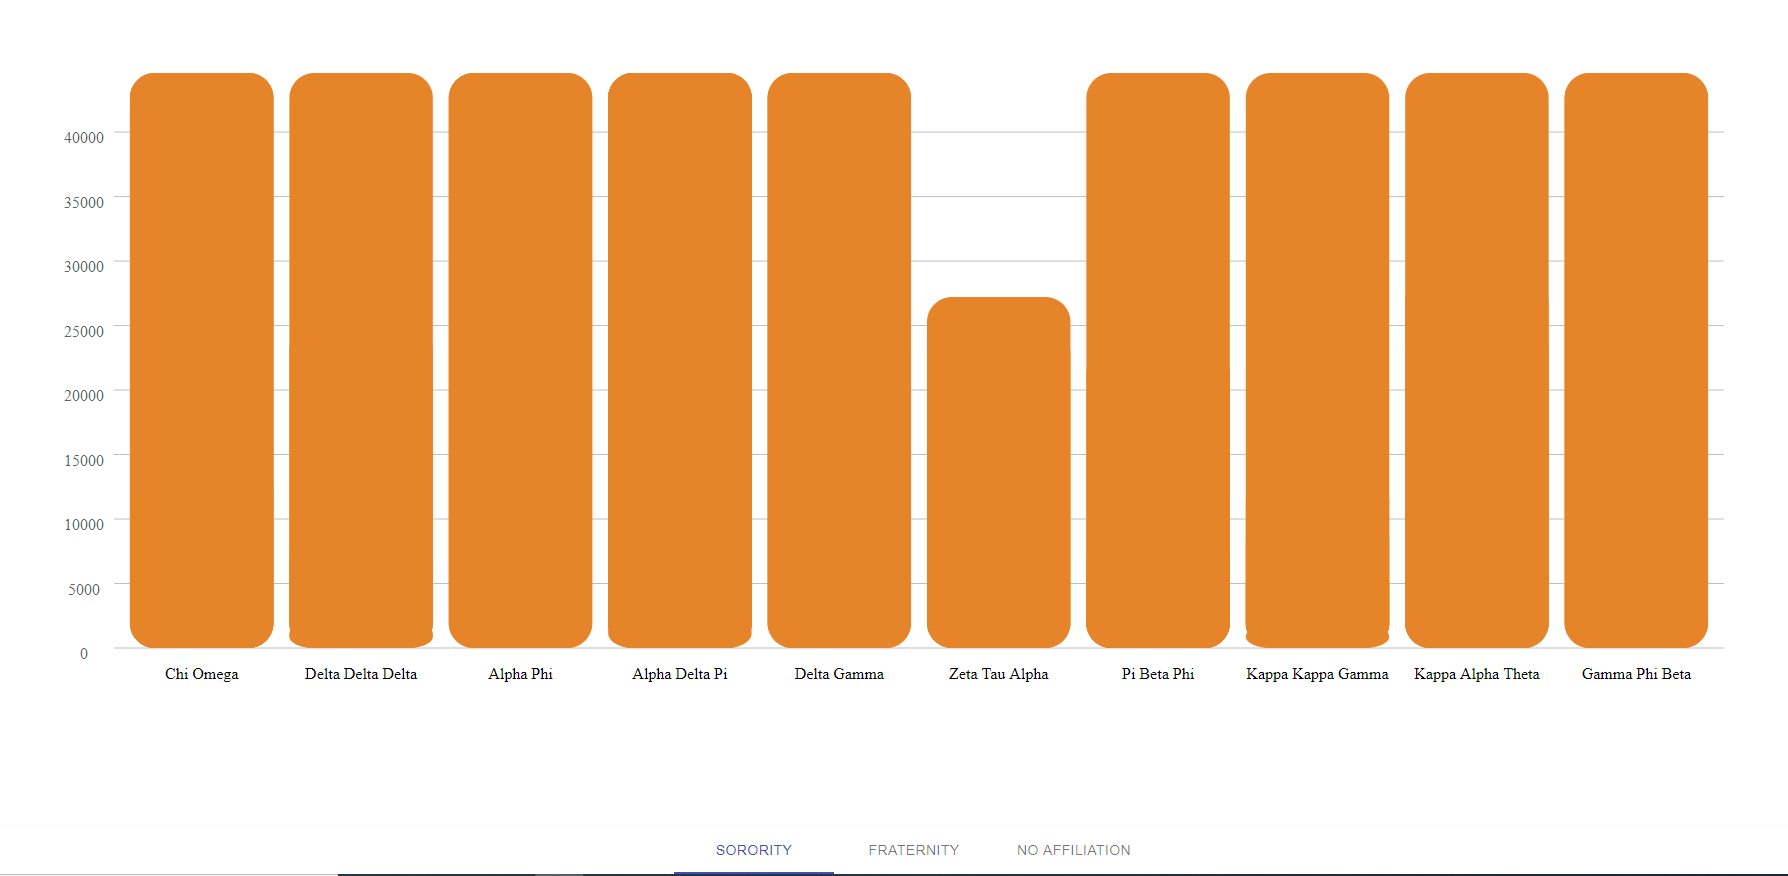
The map also allows you to click on a specific point to find out what the average tuition price is in that state. The following is the bar chart when you click on California.
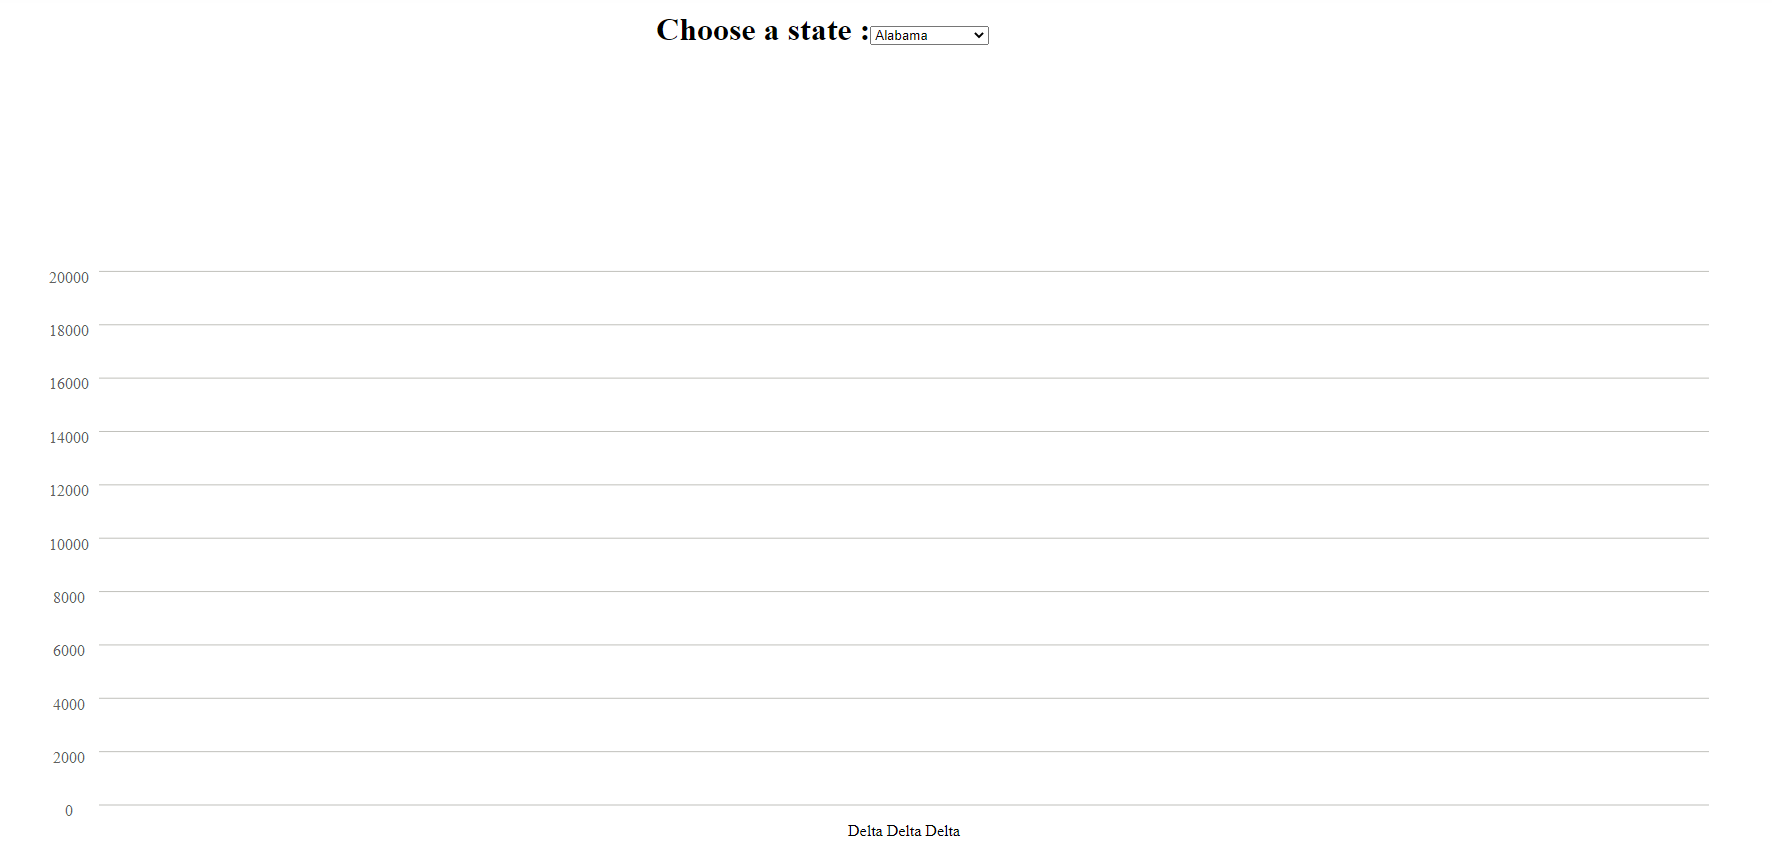
If you don't want to click on the map itself you can click the Bar Chart Page and select the specific state manually.
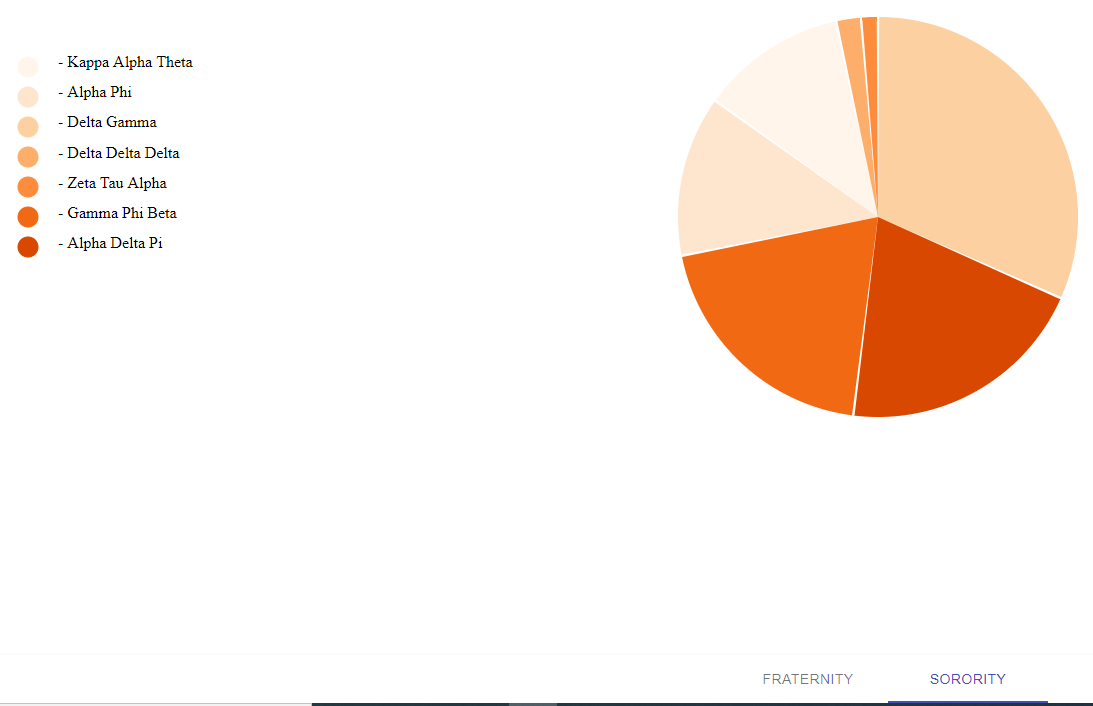
The pie chart gives you the a clear idea of which fraternity and sorority has the highest average tuition is.
As we can see that Sigma Chi has the highest average tuition out of all the fraternities.
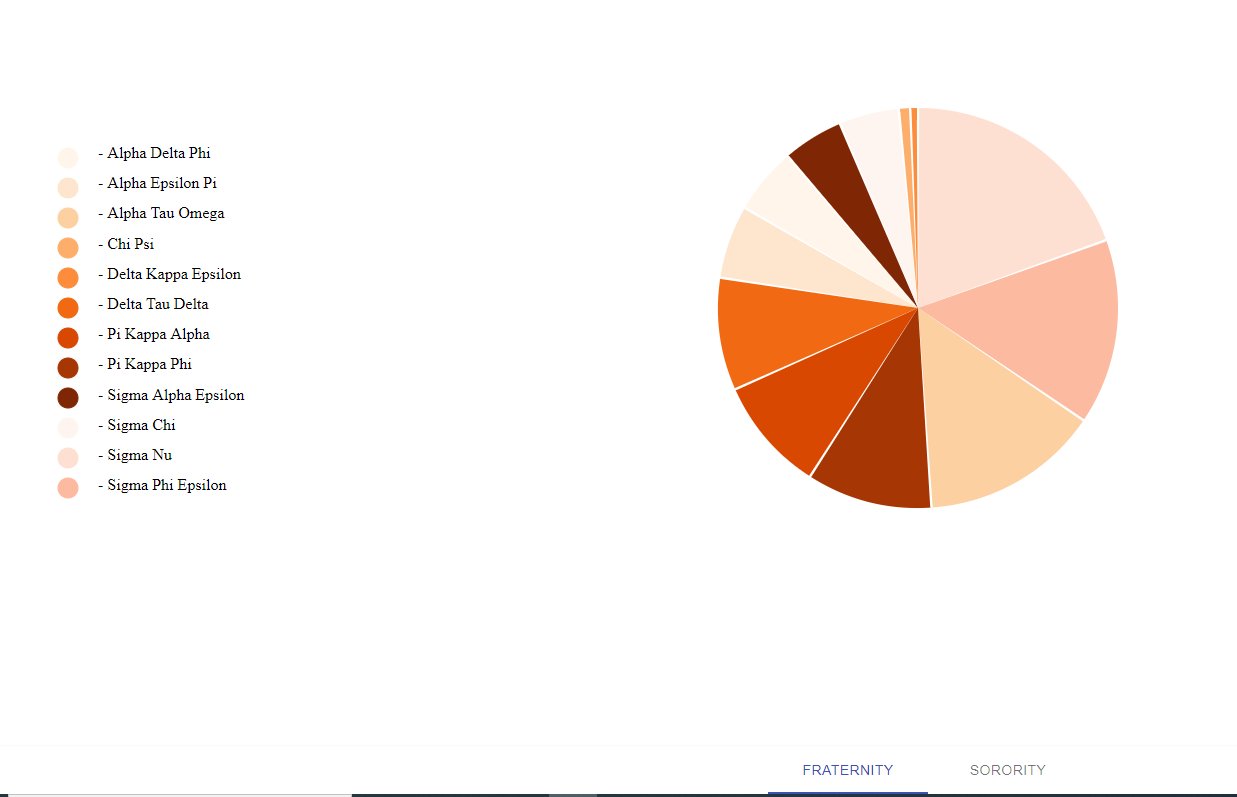
Delta Gamma has the highest average tuition out of all the sororities.
I would like to acknowledge Prof. Kelleher for his teaching and his time in helping me figure out how to make a vertical bar chart and pie chart for my final project. I would also like to thank all the developer of the respective libraries I am using for my final project. My project would not have been possible without Prof. Kelleher and the respective developers.