Torch-eCpG is a GPU enabled expression quantitative trait methylation (eQTM) mapper to identify expression associated CpG (eCpG) loci with python CLI using pytorch.
If you use Torch-eCpG in your research, please cite the following paper: Kober, K.M., Berger, L., Roy, R. et al. Torch-eCpG: a fast and scalable eQTM mapper for thousands of molecular phenotypes with graphical processing units. BMC Bioinformatics 25, 71 (2024). https://doi.org/10.1186/s12859-024-05670-4
A docker image is now available for the Torch-eCpG (tecpg) tool to perform eQTM mapping analysis. The docker image provides a pre-configured environment for running tecpg.
The image can be created from the instructions in the docker-related/ directory.
Alternatively, a full image is available for download from docker hub: https://hub.docker.com/repository/docker/kordk/torch-ecpg/general
Pip install from github using git+https://.
pip install git+https://github.com/kordk/torch-ecpg.gitIf you want to be able to edit the code for debugging and development, install in editable mode and do not remove the directory.
cd [path/to/code/directory]
git clone https://github.com/kordk/torch-ecpg.git
cd torch-ecpg
pip install --editable .
tecpg is an entry point in the command line than calls the root CLI function. If the installation was successful, running tecpg --help should provide help with the command line interface.
If you have issues with using pip in the command line, try python -m pip or python3 -m pip.
tecpg can calculate on the CPU or on a CUDA enabled GPU device. CUDA devices are generally faster than CPU computations for sufficiently large inputs.
The program will automatically determine whether there is a CUDA enabled device and use it if available. To force calculation on the CPU, set the --threads option to a nonzero integer. This will also set the number of CPU threads used.
Methylation values, gene expression values, and covariates are provided in CSV or TSV files in the <working>/data directory. For methylation and gene expression, columns are for individual samples and each row is for a loci. For the covariates, the columns are the type of covariate and the rows are the sample. Annotation files are used for region filtration and are stored in the <working>/annot. They use the BED6 standard and store the positions of the methylation or gene expression loci.
Methylatlion CSV datafiles from the GTP dataset (see Demostration below):
head -5 data/M.csv | cut -d, -f1-5,5881,5896,5915,5949
cg00000029,0.551142626425936,0.606679809418831,0.593760482022385,0.554829598676022
cg00000108,0.998563692332771,0.9979593001545,0.997893371350954,0.997293677663346
cg00000165,0.266529984719736,0.159711109475489,0.145981687514545,0.100000350688528
cg00000236,0.812799925026805,0.897011511592051,0.908067942964869,0.863719773724759
Gene expression CSV datafiles from the GTP dataset (see Demostration below):
head data/G.csv | cut -d, -f1-5,5881,5896,5915,5949
ILMN_1762337,43.10106,48.30485,37.49239,43.99564
ILMN_2055271,61.09617,61.84258,47.78094,49.32763
ILMN_1736007,51.30634,45.80393,45.43285,40.39254
ILMN_2383229,48.15523,42.69902,35.71749,39.52501
head -5 data/C.csvCovariate CSV datafiles from the GTP dataset (see Demostration below):
,Sex,age
5881,1,44
5896,1,50
5915,0,52
5949,1,56
Annotation BED6 files for the gene expression and methylation data (i.e., Illumina HumanHT-12 and Illumina MethylationEPIC arrays):
head -5 annot/*==> annot/G.bed6 <==
chrom chromStart chromEnd name score strand
2 128604584 128604633 ILMN_1792672 0 -
11 193773 193822 ILMN_3237022 0 +
13 44410552 44410601 ILMN_1904052 0 -
17 79524173 79524222 ILMN_1807600 0 -
==> annot/M.bed6 <==
chrom chromStart chromEnd name score strand
20 61847650 61847650 cg18478105 0 -
X 24072640 24072640 cg09835024 0 -
9 131463936 131463936 cg14361672 0 +
17 80159506 80159506 cg01763666 0 +
Example data for evaluation can be created with tecpg:
tecpg data --help[INFO] CUDA GPU detected. This device supports CUDA.
Usage: tecpg data [OPTIONS] COMMAND [ARGS]...
Base group for data management.
Options:
--help Show this message and exit.
Commands:
dummy Generates dummy data.
gtp Downloads and extracts GTP data.
tecpg run mlr without chunking creates one output file named out.csv by default in the output directory. If any chunking is used, methylation chuking, gene expression chunking, or both, potentially multiple files are created in the output directory. They are labeled {methylation chunk number}-{gene expression chunk number}.csv.
The rows labels of a csv output file indicate the gene expression id and the methylation id. The columns indicate what regression results that column represents. Methylation related labels are prefixed with mt_, and gene expression related labels are prefixed with gt_. The four regression results returned are the estimate est, the standard error err, the Student's T statistic t, and the p-value p.
If the input is too large, the computational device may run out of memory. Chunking can help prevent this by partitioning the data into chunks that are computed and saved separately. Chunking sacrifices parallelization, and thus speed, for lower memory. Avoid chunking wherever possible for speed.
For tecpg run mlr, there are two types of chunking: methylation chunking and gene expression chunking. Gene expression chunking is preferable to methylation chunking if possible, as it sacrifices parallelization less. Chunking should be avoided unless required to conform to memory constraints. Use tepcg chunks to estimate the number of gene expression loci per chunk given certain parameters.
You may want to include only certain regression results. There are two ways of filtering the results:
- P-value filtration - all p-values are computed first. Then, regression results with a p-value above a supplied threshold are excluded from the output. This decreases output size and thus increases speed as saving is an expensive operation.
- Region filtration - region filtration requires annotation files that dictate the positions of methylation and gene expression ids. Then, regressions are filtered by one of the following methods:
- Cis: the position of the gene expression id and methylation id is within a supplied window and they lie on the same chromosome.
- Distal: the position of the gene expression id and methylation id is outside of a supplied window and they lie on the same chromosome.
- Trans: the gene expression id and methylation id lie on different chromosomes.
- All: no filtration.
P-value filtration filters results after calculating the regression. Region filtration filters the input before the regression results are computed.
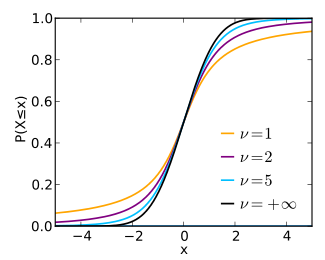
The p-values returned by tecpg run mlr are approximations using the normal distribution CDF. This approximation is more accurate for larger degrees of freedom. As the number of degrees of freedom approaches
For example:
- For 336 degrees of freedom and test t-statistic of 1.877, the percent difference between the normal CDF and Student CDF is 0.04469%.
- For 50 degrees of freedom and test t-statistic of 1.877, the percent difference between the normal CDF and Student CDF is 0.30206%.
The user should determine whether this accuracy is suitable for the task and the degrees of freedom.
This image from https://en.wikipedia.org/wiki/Student%27s_t-distribution shows the deviation of the Student's T distribution CDF from the normal CDF represented as
Student T CDF comparison
Currently, the README and the tecpg ... --help commands serve as documentation. Within the code, the function docstrings provide a lot of information about the function. The extensive type hints give added insight into the purpose of functions.
Here is a demonstration of tecpg using real data publicly available from the n=340 participants from the Grady Trauma Project (GTP) (Gene Expression Omnibus (GEO) accession numbers GSE72680, GSE58137). The participants were assayed using the Illumina HumanMethylation450 (n=349,220 CpG loci) and HumanHT-12 (n=39,353 expression probes) arrays.
- Create the evaluation directory
mkdir test; cd test- Download and prepare the GTP example dataset
tecpg data gtp[INFO] CUDA GPU detected. This device supports CUDA.
Are you sure you want to overwrite the data directory? [y/N]: y
[INFO] Creating directory /home/kord-test/proj/torch-ecpg/eval/GTP...
[INFO] Removing directory /home/kord-test/proj/torch-ecpg/eval/GTP...
[INFO] Creating directory /home/kord-test/proj/torch-ecpg/eval/GTP...
[INFO] Downloading GTP raw data (this could take a very long time)
[INFO] Downloading 4 files...
[INFOTIMER] Downloading 1/4: CovariateMatrix.txt.gz...
[INFOTIMER] Downloaded in 0.0631 seconds
[INFOTIMER] Downloading 2/4: MethylationBetaValues.tsv.gz…
[INFO] Reading 3 csv files...
[INFOTIMER] Reading 1/3: MethylationBetaValues.tsv.gz
[INFO] Reading csv file /home/kord-test/proj/torch-ecpg/test/GTP/MethylationBetaValues.tsv.gz with separator [tab]
[INFOTIMER] Read 1/3 in 105.2349 seconds
[INFOTIMER] Reading 2/3: GeneExpressionValues_1.tsv.gz
[INFO] Reading csv file /home/kord-test/proj/torch-ecpg/test/GTP/GeneExpressionValues_1.tsv.gz with separator [tab]
[INFOTIMER] Read 2/3 in 1.8076 seconds
[INFOTIMER] Reading 3/3: GeneExpressionValues_2.tsv.gz
[INFO] Reading csv file /home/kord-test/proj/torch-ecpg/test/GTP/GeneExpressionValues_2.tsv.gz with separator [tab]
[INFOTIMER] Read 3/3 in 4.6601 seconds
[INFOTIMER] Finished reading GTP csv files in 111.703 seconds.
[INFO] Concatenating gene expression parts
[INFO] Removing covariates without enough data for all samples
[INFO] Dropping unneeded columns (p-values)
[INFO] Normalizing column names
[INFO] Removing nonoverlapping columns
[INFO] Dropped 17337 rows of G with missing values (69.4173% remaining)
[INFO] Dropped 104132 rows of M with missing values (77.0306% remaining)
[INFO] Sorting columns
[INFO] Saving into /home/kord-test/proj/torch-ecpg/test/data
[INFO] Creating directory /home/kord-test/proj/torch-ecpg/test/data...
[INFO] Saving 3 dataframes...
[INFOTIMER] Saving 1/3: M.csv
[INFOTIMER] Saved 1/3 in 151.9341 seconds
[INFOTIMER] Saving 2/3: G.csv
[INFOTIMER] Saved 2/3 in 9.7193 seconds
[INFOTIMER] Saving 3/3: C.csv
[INFOTIMER] Saved 3/3 in 0.0022 seconds
[INFOTIMER] Finished saving 3 dataframes in 161.6562 seconds.
[WARNING] GTP methylation, gene expression, and covariates downloaded. If you would like to use region filtration, please manually copy the associated files from the tecpg/demo directory or produce them yourself.
- Copy and rename the demo annotation files to their default locations. We created these annotation files to be used with these arrays. The users will need to create their own for datasets using other arrays or measuring approaches (e.g., RNA-seq).
mkdir annot
cp ../demo/annoEPIC.hg19.bed6 annot/M.bed6
cp ../demo/annoHT12.hg19.bed6 annot/G.bed6- Run the CIS loci analysis. This analysis has a small memory footprint and completes quickly.
tecpg run mlr --help[INFO] CUDA GPU detected. This device supports CUDA.
Usage: tecpg run mlr [OPTIONS]
Options:
-g, --gene-loci-per-chunk INTEGER
-m, --meth-loci-per-chunk INTEGER
-p, --p-thresh FLOAT
--all [default: all]
-w, --window INTEGER
--cis [default: all]
--distal [default: all]
--trans [default: all]
-f, --full-output [default: False]
-P, --p-only [default: False]
--help Show this message and exit.
tecpg run mlr --cis -p 0.00001 -g 10000 -m 10000We have run into this issue when using a development system or a cluster (e.g., Sun Grid Engine) where the system has numerous GPUs and selection is necessary.
Find the ID of the GPU you’d like to use:
nvidia-smi
Fri Dec 15 13:33:36 2023
+---------------------------------------------------------------------------------------+
| NVIDIA-SMI 530.30.02              Driver Version: 530.30.02    CUDA Version: 12.1     |
|-----------------------------------------+----------------------+----------------------+
| GPU  Name                  Persistence-M| Bus-Id        Disp.A | Volatile Uncorr. ECC |
| Fan  Temp  Perf            Pwr:Usage/Cap|         Memory-Usage | GPU-Util  Compute M. |
|                                         |                      |               MIG M. |
|=========================================+======================+======================|
|   0  NVIDIA A2                       On | 00000000:81:00.0 Off |                    0 |
|  0%   38C    P8                9W /  60W|      0MiB / 15356MiB |      0%      Default |
|                                         |                      |                  N/A |
+-----------------------------------------+----------------------+----------------------+
|   1  NVIDIA L4                       On | 00000000:82:00.0 Off |                    0 |
| N/A   54C    P8               18W /  75W|      0MiB / 23034MiB |      0%      Default |
|                                         |                      |                  N/A |
+-----------------------------------------+----------------------+----------------------+

+---------------------------------------------------------------------------------------+
| Processes:                                                                            |
|  GPU   GI   CI        PID   Type   Process name                            GPU Memory |
|        ID   ID                                                             Usage      |
|=======================================================================================|
|  No running processes found                                                           |
+---------------------------------------------------------------------------------------+
Here, we see GPU 0 is the A2 (previous one) and GPU 1 is the L4 (new one).
Selection of the GPU to use can be done through software (e.g., https://discuss.pytorch.org/t/selecting-the-gpu/20276) or using the shell. For software that we are not going to be editing directly (e.g., tecpg), we use the shell variable direction.
The the environment variable CUDA_VISIBLE_DEVICES can be set when you call python.
To use the A2 GPU, the following re-mapping works:
CUDA_VISIBLE_DEVICES=1,0 python tecpg run mlr --all --p-thresh 0.000001 -g 100 -m 100000To use the L4 GPU, the following re-mapping works:
CUDA_VISIBLE_DEVICES=0,1 python tecpg run mlr --all --p-thresh 0.000001 -g 100 -m 100000This work was partially supported by an NIH NCI MERIT award (R37, CA233774, PI: Kober) and Cancer Center Support Grant (P30, CA082103, Co-I: Olshen).